
Health effects caused by tritium (H-3) in the data (9) | Locally released tritium -Infant death and stillbirth demographics- (6)

NOTE ver.
Original: Abstract & Method, etc.
On Facebook, https://www.facebook.com/Yukiho.Takizawa
The post: https://www.facebook.com/Yukiho.Takizawa/posts/775099309595720
Update date: 2019.11.27
To make the report📖 https://facebook.com/Yukiho.Takizawa/posts/775099309595720 on Facebook available to medical professionals and university students who do not have a Facebook community account, on note https://note.com, the contents were released with matsunoya|note 🔗
https://note.com/matsunoya_note/n/n2b353743dcbd
The overview has been updated on the Twitter thread.
Charts📊 and Tables📜:
on web site
https://matsunoya.thebase.in/blog/2019/11/06/171500
Digital Download on the EC shop https://matsunoya.thebase.in/categories/1074110
Overview👩🏫:
on Twitter
https://twitter.com/Mats_blnt_pharm/status/1191998583664521216?s=20
その9🌱データで見るトリチウム(H-3)の健康影響(9)|局所的に放出されたトリチウム☢
— MATSUNOYA.BlNt.Pharm (@Mats_blnt_pharm) November 6, 2019
- 乳児死亡および死産の人口動態を例として - (6)#松廼屋|論点解説 薬剤師国家試験対策ノート #衛生/#疫学研究 論点:放射線/#トリチウム 松廼屋 Mats.theBASE #薬剤師国家試験対策📒https://t.co/tqGQCNqrgN
Author: Yukiho Takizawa Facebook profile https://www.facebook.com/Yukiho.Takizawa
CONTACT✉:
https://thebase.in/inquiry/matsunoya
Abstract:
Focusing on infant mortality rates from 22 weeks of pregnancy to less than 1 year of age (hereinafter referred to as total mortality rate) , Fukui Prefecture and all prefectures were compared the annual trends in relative risk (RR), attributable risk (AR) and percent of attributable risk (PAR; %) regarding mortality rates which were calculated from the number of stillbirths after 22 weeks of gestation and the number of infant deaths based on demographic data (1995-2017) from the Ministry of Health, Labor and Welfare.
The purpose of the study was to explore the relationship exploratorily through investigating the possibility of increased health effects (perinatal mortality, infant mortality) due to factors in pregnant women and infants (internal exposure caused by tritium water in water or food), and the relationship between causal factors and mortality.
Eleven prefectures were selected as controls assuming no exposure, and factor exposure groups (assuming tritium radioactivity exposure from the atmosphere or beverages/food) were observed in Fukui prefecture, surrounding prefectures, and all prefectures based on the trends of PAR as epidemiological indicators of the total mortality in each prefecture.
As a result, the PAR average of the total mortality rates in each year of all prefecture showed a positive linear correlation with the annual maximum value of tritium radioactivity released locally (mBq/L, atmospheric moisture). The PARs highly correlated with the cumulative average of tritium radioactivity concentration (highest annual value) for 6 years especially, assuming a positive linear correlation with zero intercepts (Y=4.158919044623*E^(-04)*X, R^2=0.9687).
In addition, the linearity correlation between total mortality PAR and locally released tritium radioactivity concentration showed an increasing trend between the average from 1 year ago (R^2=0.9015) and the average from 6 years ago.
On the other hand, the linearity correlation showed a decreasing trend between the cumulative average from 6 years ago and the cumulative average from 18 years ago (R^=0.9244).
This is the first finding that demonstrates that the PAR of infant mortality from perinatal death to less than one year after birth can be explained by a linear correlation by tritium radioactivity concentrations (maximum value of each year) in the short-term accumulation that released locally.
The calculated average value of PAR (1995-2017) was 10.38%, and the highest value in the annual trend was 14.95% in 2012 to follow 14.93% in 2010, and 13.35% in 2013. The number of stillbirths after 22 weeks of gestation is 99272 fetuses, while the number of deaths within the first year of life is 70891 (1995-2017). When multiplied by PAR 10.38%, an estimated more than 17658 deaths were attributed to the factor (Fukui's H-3) exposure.
Tables and figures:
See URL: https://matsunoya.thebase.in/blog/2019/11/06/171500
1. PAR


2. RR


Introduction:
Tritium is a radioactive isotope of hydrogen that emits low-energy beta rays (up to 18.6 keV / average 5.7 keV). The physical half-life is 12 years. Tritium derived from nature is generated by the collision of cosmic ray neutrons and nitrogen nuclei in the upper atmosphere and is taken into the natural water circulation system. On the other hand, artificial tritium has been released into the environment mainly in the form of tritium water (HTO) from nuclear tests and nuclear facilities (ref.5, 5-2).
The largest source of tritium in the global environment was the atmospheric nuclear test, especially the water bomb test since 1954. It is estimated that about 200 times the amount of tritium derived from nature was released before the conclusion of the 1963 Treaty of Stopping the Atomic Nuclear Test. As a result, the level of tritium in the environment increased greatly, but since 1963, atmospheric tritium derived from nuclear tests has shown a downward trend due to physical collapse and transfer to seawater. Tritium in the environment moves to the ground due to atmospheric circulation and rainfall and is widely distributed in air, environmental water (river water, groundwater, seawater, etc.), plants and animals. The tritium concentration in precipitation measured before the start of the nuclear test is 0.77Bq/L. It increased from 12 to 180Bq/L in the early 1960s. After that, it began to decrease, and now (Reference 3) is almost returning to the level before the nuclear test (ref.5, 5-2).
Tritium is relatively easily taken up by living organisms. Very easily absorbed by the human body, and organically bound tritium (OBT) behaves differently from tritium. Tritium water ingested from drinking water and food is almost completely absorbed from the gastrointestinal tract while breathing air containing tritium water vapor, tritium is taken into the lungs and mostly enters the blood. Blood tritium migrates to cells and is distributed almost evenly in body fluids within 24 hours. In addition, tritium is absorbed from the skin. On the other hand, organically bound tritium (OBT), when taken up as an organic component, is generally slowly excreted and tends to stay in the body longer. Tritium has the same chemical properties as hydrogen, so it binds to organic substances such as proteins, sugars, and fats, which are the main compounds in living organisms. The biological half-life of ingested tritium water is about 10 days, whereas that of organically bound tritium is supposed to stay for about 30 to 45 days.
The effects of external exposure from tritium β-rays are negligible, while radiation effects, which are a challenge with tritium, are internal exposure (ref. 5, 5-1).
In the case of human beings, there were few accidental cases of internal exposure to tritium, and the relationship between exposure dose and disability has been mainly estimated from animal experiments. RBE (Relative Biological Effectiveness), an index that represents the biological effect of radiation, is often over 1 for tritium β-rays when the reference radiation is γ-rays.
Since tritium water is considered to exhibit the same distribution as water after being absorbed in the body, it is distributed widely and uniformly in the body water. Furthermore, a very non-uniform dose distribution can result from the incorporation of tritium labeled DNA precursors (eg thymidine, deoxycytidine). Due to the specific location of the emitter and the very short range of tritium beta rays, the cell nucleus may be exposed to a dose much higher than the average dose of cells or organs/tissues. Therefore, tritium-labeled DNA precursors may be more radioactively toxic than tritium-labeled compounds that are not particularly located in the cell nucleus, such as tritium water (ref. 6).
There is still almost no clear epidemiological survey on its radioactive concentration and its health effects.
In this epidemiological analysis study, focusing on infant mortality rates from 22 weeks of pregnancy to less than 1 year of age (hereinafter referred to as total mortality rate) , Fukui Prefecture and all prefectures were compared the annual trends in relative risk (RR), attributable risk (AR) and percent of attributable risk (PAR; %) regarding mortality rates which were calculated from the number of stillbirths after 22 weeks of gestation and the number of infant deaths based on demographic data (1995-2017) from the Ministry of Health, Labor and Welfare. The purpose of the study was to explore the relationship exploratorily through investigating the possibility of increased health effects (perinatal mortality, infant mortality) due to factors in pregnant women and infants (internal exposure caused by tritium water in water or food), and the relationship between causal factors and mortality.
In this report, using PAR of mortality as an indicator, it will be presented that the first findings obtained to determine how much locally released tritium radioactivity concentration affected the total mortality as a factor exposure.
Methods:
1. Data source
The number of stillbirths after 22 weeks of pregnancy, the number of infant deaths less than one year after birth, and the number of live births (1995-2017) were obtained from the Ministry of Health, Labor and Welfare's prefectural demographic database.
Web site: a portal site for Japanese Government Statistics e-Stat https://www.e-stat.go.jp/ Regional Statistics Database (System of Social and Demographic Statistics) https://www.e-stat.go.jp/regional-statistics/ssdsview (ref. 1)
item name:
A4101_出生数【人】 / Number of births
A4271_死産数(妊娠満22週以後)【胎】 / Number of stillbirths (after 22 weeks of pregnancy)
A4281_乳児死亡数【人】 / Number of infant deaths
The total number of stillbirths after 22 weeks of pregnancy and the number of infant deaths less than 1 year after birth were divided by the number of births (stillbirths + live births) and multiplied by 1000 to calculate the total mortality rate (per 1000 births). The mortality calculation formula was based on the formula published in the Ministry of Health, Labor and Welfare's Demographic Statistics Report (2018) (ref. 2).
The number of deaths in 2018 was calculated based on the 2018 demographic monthly report (approximate number) (ref. 2).
2018 Demographic Statistics Monthly Report (Approximate Number) https://www.mhlw.go.jp/toukei/saikin/hw/jinkou/geppo/nengai18/index.html Download Excel file
Statistical table h30toukeihyou-190626.xls Table 8 ①-Table 8 ②
The radioactivity concentration of tritium in the atmosphere was downloaded from the website on which a part of the environmental radioactivity survey conducted by the Nuclear Regulatory Agency was published. The annual maximum value was independently extracted from all data. The annual maximum values (1977-2017) were all measured at the location of the nuclear power plant in Fukui Prefecture.
The radioactivity concentration of tritium in the atmosphere
Web site: Japanese environmental radioactivity and radiation https://kankyo-hoshano.go.jp/kl_db/servlet/com_s_index
Environmental Radiation Database https://search.kankyo-hoshano.go.jp/servlet/search.top (ref. 3)
The main cause of infant death in Japan is DNA abnormalities (ref. 2). The effect of tritium β-rays on DNA is a stochastic effect with no threshold. From this, the local maximum annual tritium concentration is estimated to have the largest stochastic effect, so the maximum value was used for the correlation.
2. PAR
The equations and definitions of AR and PAR are based on Reference 4.
AR is the risk difference (Equation 1). This is the difference between the morbidity rate (mortality) in the factor-exposed group and in the non-exposed group.
Attributable risk (AR) = [A / (A + B)] - [C / (C + D)] …(Equation 1)
A: the number of deaths, the factor-exposed
A+B: the number of births, the factor-exposed
C: the number of deaths, the non-exposed
C+D: the number of births, the non-exposed
PAR is the ratio of AR to morbidity (mortality) in the factor exposure group. Dividing AR by the prevalence of the factor exposure group and multiplying by 100 (%) (Equation 2), among the patients in the factor exposure group (eg, internal exposure to beta rays).
A measure of the percentage of pregnant women or infants who have reached an outcome (eg stillbirth or infant death) that really be affected by the factor exposure.
Percent of attributable risk (PAR) = AR / [A / (A + B)] x 100 ... (Equation 2)
Since it is assumed that there is no factor exposure in the control that is in Japan, the PAR value may be estimated to be smaller than the accurate. On the other hand, if there is a confounding bias, it may not be considered an effect of factor exposure alone.
3. Statistics
PAR was calculated for each year for each prefecture. The mortality rate for each of 11 prefectures (Nagano, Hyogo, Okayama, Hiroshima, Kagawa, Ehime, Tottori, Shimane, Saga, Kumamoto, Miyazaki) was used as the control.
The average PAR of mortality rate “全死亡率_PAR11県 (Total mortality_PAR 11prefecture)” was calculated for all prefectures by averaging the PAR of each prefecture with 11 prefectures as controls. From this, the average value for each year in all prefectures was calculated and used as the PAR for each year.
A linearity correlation was assumed, where X is the highest radioactivity concentration of tritium in the atmosphere for each year, Y is PAR for each year, and the intercept is 0. Since this correlation was divided into two layers, it was divided into year groups 1 and 2.
Group 2 had a relatively low PAR against the radioactive concentration of tritium. Therefore, assuming an increase in mortality in 11 prefectures due to exposure to controls, PAR was estimated for group 2 using a control value calculated from the mortality of group 1 using a quadratic polynomial approximation (Equation 3).
Simulated control mortality
Y =0.007942017284*([@year])^2-32.073848496863*([@year])+32386.7232991442 …(Equation 3) R^2=0.7869
A linearity correlation was calculated with the estimated PAR group 2 (by estimated with simulated control mortality) combined with the group 1 PAR. The reconstructive Y and the maximum radioactive concentration of tritium in the atmosphere (X) was calculated the statistical. For calculation of all statistical values, Microsoft Excel function (=LINEST) or regression of analysis tool was used. The slope and intercept were calculated by a linear least-squares program. The linearity correlation between X and Y assumed an intercept of 0. This is because PAR takes intercept 0 if the control is the unexposed group. The degree of linearity correlation is mainly determined by the coefficient of determination R^2. The F value (=regression variance / residual variance) in the regression equation was compared with the F boundary value.
F boundary value = 8; significance level 0.01, freedom of regression variance 1, freedom of residual variance 21
4. RR
The equation and definition of RR is based on Reference 4.
RR is the risk ratio (Equation 4). This is the ratio between the morbidity rate (mortality) in the factor-exposed group and in the non-exposed group.
Relative risk (RR) = [A / (A + B)] / [C / (C + D)] …(Equation 4)
RR allows us to infer whether the factor is related to the disease. In other words, the relationship between factor exposure and disease morbidity: how many times more likely to be affected by the factor exposure than when not exposed to the factor (how many deaths in the case of mortality). It indicates the strength of relative danger.
The data of the annual transition of the individual were confirmed to correlate with the annual transition of the maximum value of tritium radioactivity concentration in locally released atmospheric water.
RRs were classified into year groups 1 and 2 according to PAR statistics. The simulated mortality calculated by the approximate formula (Equation 3) derived from the annual group 1 mortality was used to determine the simulated RR (group 1_sim & group 2_sim).
The calculated average RR-1(Y_average) and simulated RR-1(Y_simulated) were examined to correlate with the cumulative annual transition of the maximum value of tritium radioactivity concentration(X) in locally released atmospheric water.
Result:
1. The annual transition of locally released tritium radioactivity concentration
The maximum annual value of tritium released in 1977-2017 (mBq/L, moisture in the atmosphere) was extracted to investigate the health effects of locally released tritium in Japan, and to investigate the causal relationship between the factor exposure (eg, internal exposure from tritium β-rays) and total of stillbirth after 22 weeks of gestation and death within 1 year of birth.
The maximum annual tritium radioactivity concentration in the atmosphere is derived from the test values in Takahama Town, Fukui Prefecture from 1996 to 2017. On the other hand, from 1977 to 1995, most cases came from Tsuruga City in 12 years. The rest were also inspection values in Fukui Prefecture (Fukui City, Mihama Town, Ooi Town).
Between 1977 and 2017, the highest tritium radioactivity concentration in the atmosphere is 52000mBq/L in 2007. The 2nd-7th highest values are 39000mBq/L in 2009, 36000mBq/L in 2006, 35000mBq/L in 2010, 34000mBq/L in 2011, 33000mBq/L in 2008, 31000mBq/L in 1998. Most of the higher radioactivities were observed in the year 2006-2011. Significantly high radioactivity release started in 1996.
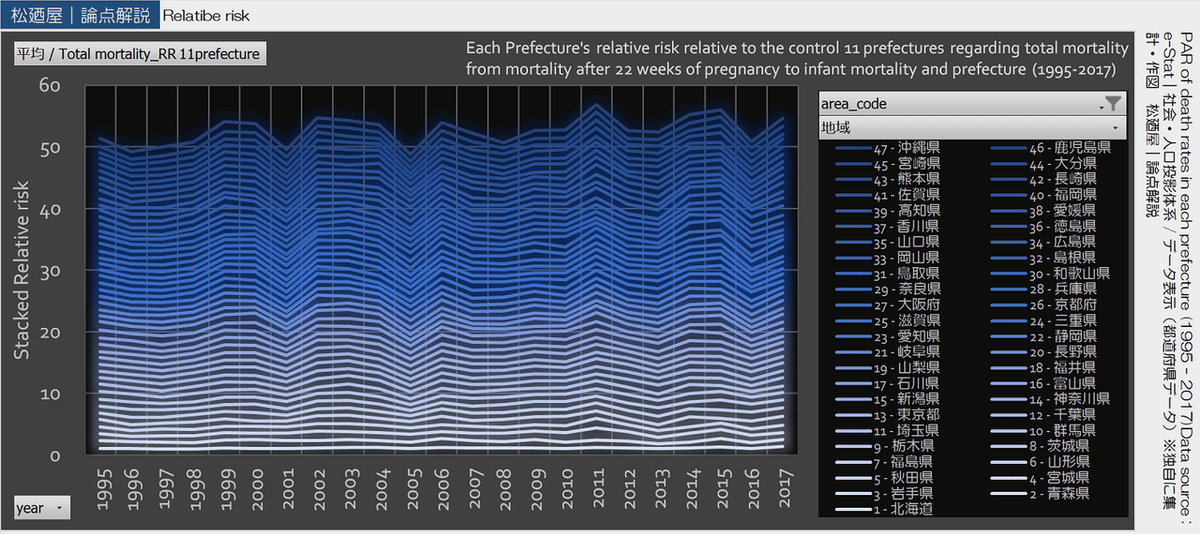
2. The annual transition of PAR
The mortality PAR for the total of stillbirth after 22 weeks of gestation and infant mortality under the first year of life was calculated based on prefectural data. PAR with 11 prefectures as control is averaged for each prefecture. The PAR in each prefecture was not uniform, and there was a disparity between prefectures. The ranking of prefecture PARs fluctuated from year to year during 1995-2017. The average of PAR in 1995-2017 in 11 prefectures (as controls; Nagano, Hyogo, Okayama, Hiroshima, Kagawa, Ehime, Tottori, Shimane, Saga, Kumamoto, Miyazaki) was lower than in other prefectures. The highest average value (1995-2017) was 18.2% in Okinawa, and the second-highest was 17.6% in Iwate. In the maximum value (1995-2017), 48.1% (2011) in Iwate Prefecture was the highest.
The PAR of the year for each prefecture is averaged. And those (Average / total mortality PAR_11 control prefectures) were used as an index of annual transition to examine the correlation with tritium radioactivity concentration.
3. Correlation between atmospheric tritium radioactive concentration and PAR on mortality
Assuming a linear correlation of intercept 0, a positive linear correlation was found between the maximum atmospheric tritium radioactivity concentration for the year and the PAR for mortality.
In the correlation, PAR(Y) against tritium radioactive concentration(X) was divided into two layers.
Therefore, PAR was divided into year group 1 and year group 2.
Comparing the mortality rate, the average mortality rate of the group 2 controls (11 prefectures) was higher than the average mortality rate of the group 1 controls except for Hiroshima and Kumamoto prefectures.
PAR is the ratio of the risk difference relative to the control relative to the mortality rate.
The effect of increased mortality in the subject may have apparently reduced the PAR value. So the mortality calculated from the approximate expression of the mortality of the control of group 1 (11 prefectures) was used as a control for group 2. The PAR of group 2 obtained by simulation was in the same straight line as group 1 when plotted on the correlation diagram (R^2=0.8715, Y= 0.000369617074180634*X).
A correlation between the radioactive concentration of tritium in the atmosphere a year ago and the annual change in PAR related to mortality was confirmed (R^2=0.9107, Y=0.000378295110201252*X).
In addition, there was also a positive correlation between the cumulative average of tritium radioactivity concentrations over several years (for 1-18 years) and PAR (Group 1 + Simulated Group 2). The PARs highly correlated with the cumulative average of tritium radioactivity concentration (maximum annual value) for 6 years especially, assuming a positive linear correlation with zero intercepts (Y=4.158919044623*E^(-04)*X, R^2=0.9687).
The linearity correlation between total mortality PAR and locally released tritium radioactivity concentration showed an increasing trend between the average from 1 year ago (R^2=0.9015) and the average from 6 years ago. On the other hand, the linearity correlation showed a decreasing trend between the cumulative average from 6 years ago and the cumulative average from 18 years ago (R^=0.9244).
This is the first finding that demonstrates that the PAR of infant mortality from perinatal death to less than one year after birth can be explained by a linear correlation by tritium radioactivity concentrations (maximum value of each year) in the short-term accumulation that released locally.
The calculated average value of PAR (1995-2017) was 10.38%, and the highest value in the annual trend was 14.95% in 2012 to follow 14.93% in 2010, and 13.35% in 2013. The number of stillbirths after 22 weeks of gestation is 99272 fetuses, while the number of deaths within the first year of life is 70891 (1995-2017). When multiplied by PAR 10.38%, an estimated more than 17658 deaths were attributed to the factor (Fukui's H-3) exposure.
The average value of PAR in all prefectures calculated from the mortality rate in 2018 was 5.34% when calculated as Group 2, and was consistent with the estimated value. The PAR estimated from cumulative tritium radioactivity concentration from 6 years ago in 2018 was 6.22%.
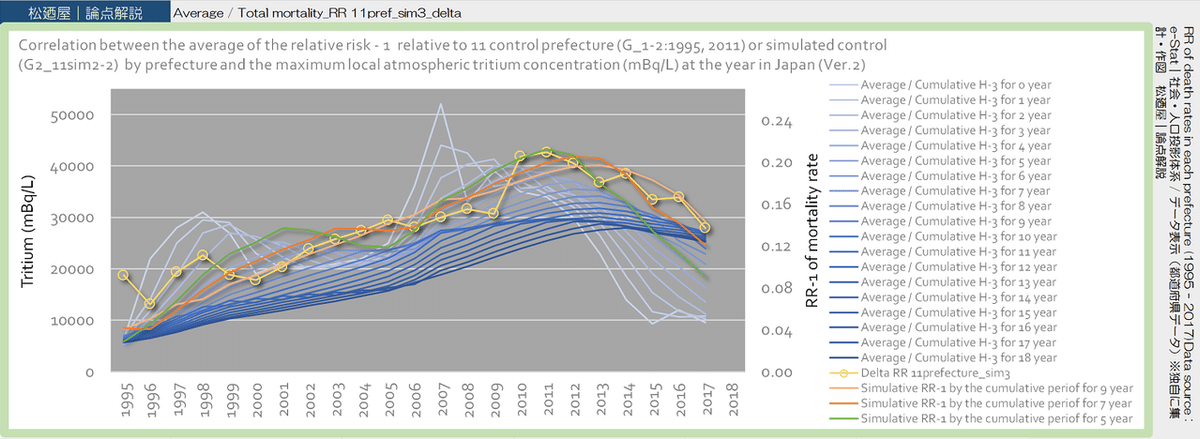
4. Correlation between atmospheric tritium radioactive concentration and RR on mortality
Assuming a linear correlation of intercept 0, a positive linear correlation was found between the maximum atmospheric tritium radioactivity concentration for the year and the RR - 1 for mortality.
In the correlation, RR - 1(Y) against tritium radioactive concentration(X) was divided into two layers.
The mortality was obtained by an approximate expression (Equation 3) from the annual change in mortality of Group 1. The RR calculated from this simulated mortality rate as the control was positively correlated with the cumulative annual value of atmospheric tritium radioactivity concentration.
The correlation was greater for the simulated value alone than for group 1 as the mean and group 2 as the simulated value.
Therefore, in the simulation, average values were used only in 1995 and 2011 when the correlation was small, and the simulated values were used for the remaining RRs.
This data set showed a positive correlation with the cumulative average of tritium radioactivity concentration. The correlations were 0.9716, 0.9808, 0.9826, 0.9828, and 0.9801, respectively, as R^2 when the cumulative years were 6 to 10 years. The correlation was strongest in the 9 years accumulated. However, it was presumed to be the result as a percentage of the total of all cases (the cumulative for 0-18 years), with the total mortality occurring in each of multiple cumulative years.
Multiple regression analysis with the RR dataset was performed using estimated RR (ki * Xi, i = 0-18year accumulation). In the analysis, data for 1995 and 2007 were removed.
As a result, as an example, a multiple regression equation having coefficients at i = 0, 7, 9, 18year was obtained (R^2 = 0.9927, corrected R^2 = 0.9326).
Y = a (0year) * k (0year) * X (0year) / 5 + a (7year) * k (7year) * X (7year) /5+ a (9year) * k (9year) * X(9year) / 5 + a (18year) * k (18year) * X(18year) / 5
The coefficients ai (i = 0, 7, 9, 18year) were 1.109530392, 0.97791966, 1.249424932, and 1.936943668, respectively. The result of this multiple regression analysis is an example, but contributions to RR were estimated to be 21%, 19%, 24%, and 37% for each accumulated years (0, 7, 9, 18year). In other words, the contribution ratio of the cumulative atmospheric tritium radioactivity concentration to RR was estimated 1.00 : 0.88 : 1.13 : 1.75 at 0, 7, 9, 18years. However, the timing of pregnancy varies, and in fact, there is a causal relationship with the maximum value of atmospheric tritium radioactivity concentration in various cumulative years.
The average of the data set of RR for mortality rate for 1995-2017 was 1.14. The maximum RR was 1.97 in Iwate prefecture in 2011 to follow 1.85 in Tottori prefecture in 2010 and 1.71 in Iwate prefecture in 2012.
The average value of RR in all prefectures calculated from the mortality rate in 2018 was 1.09969 when calculated as Group 1, and 1.09652 as Group 2 and was consistent with the estimated value. The RR estimated from cumulative tritium radioactivity concentration from 7 years ago in 2018 was 1.10019 from the radioactivity 17337.5mBq/L.
The fact that RR showed a strong linearity relationship with tritium radioactivity concentration and intercept of 0 indicates that there is a strong relationship between the total mortality (overall death from perinatal to infant mortality) and the factor exposure. This result supported the mechanism of linear correlation in PAR of the total mortality and the tritium radioactivity.
Discussion:
This result is a shocking finding that the PAR (%) of the total mortality, which is the total of perinatal and less than 1-year mortality, can be explained only by locally released atmospheric tritium radioactivity concentration at Fukui Prefecture and DNA damage due to radiation exposure. This is an issue that should be addressed immediately. It is a deficiency in radiological safety management that a strong linearity correlation between short-term (approximately 5 years) cumulative tritium radioactivity concentration and the total mortality rates. This is because the radioactive concentration in the atmosphere of tritium water, which is a radioactive waste, was strongly suggested as a cause of death from the perinatal period to one year after birth throughout Japan.
Accumulated annual average values of atmospheric tritium for several years showed a positive linear relationship from the year of death (cumulative 0 years) to the cumulative period of 18 years. In particular, the correlation was highest in the cumulative 4 to 6 years.
This suggests that there is a strong causal relationship between the atmospheric tritium radioactivity concentration released locally at the nuclear power plant in Fukui prefecture and the total perinatal period and infant death in Japan as a whole. It is likely that over 17,000 children have been killed by improper industrial waste treatment of tritium. The value calculated from PAR may have been estimated to be less than actual because the control was in Japan. In the control prefectures, year group 2 showed an increasing trend in mortality.
The strong linear correlation between the RR and the maximum tritium radioactivity concentration in atmospheric moisture strongly suggests that internal exposure to β-rays derived from tritium water is due to an increase in the total mortality.
This would provide sufficient scientific evidence to prove that beta-ray radiation energy, a stochastic effect with no threshold, was actually strongly related to deaths related to Japanese birth. This finding in RR supported PAR estimates according to factor exposure relationships.
In the control prefecture, the average PAR in 1995-2017 was lower than in other prefectures. Further investigation is necessary for the cause, but the topography of 11 prefectures and the distance from Fukui Prefecture have common characteristics. It was suggested that the degree of radioactive contamination and the topography and other factors might be related to the degree of tritium internal exposure. Tritium water in atmospheric water vapor is distributed mainly on the surface of the earth by precipitation, reaching an equilibrium between the soil and the atmosphere. After that, it is distributed to vegetables and livestock with moisture (ref. 5). Therefore, contamination can spread to internal exposure. Precipitation caused by atmospheric water vapor is generally blocked by high altitude mountains and is divided into areas with precipitation and areas with dry winds at the top of the mountain. On the other hand, in the inland area surrounded by high altitude mountains, along the Seto Inland Sea and the inland seaside, the PAR tended to be lower than the area along the outer sea.
This was thought to be because tritium contained in the water vapor carried by the windblown from the sea to the land was not exposed as direct precipitation in the inland or along the inland sea so that the internal exposure from the tritium water was small.
This hypothesis suggests that a significant proportion of stillbirth and infant mortality occur at the level of tritiated water vapor in the atmosphere at equilibrium levels with the atmosphere. This inferred the possibility that industrial disposal of tritium at a nuclear power plant in Fukui Prefecture was not properly conducted.
Issues such as death cases including this report and an increase in cancer mortality should be resolved based on possible public health scientific grounds and avoided so that they do not happen again in the future.
It is necessary to establish new laws regarding the appropriate safety management of radioactive materials and the appropriate disposal method of radioactive industrial waste, or the revision of the existing system to the extent possible.
It was thought that outcomes (mortality) are attributed to the effects of internal radiation exposure to tritium beta radiation on embryos, fetuses, and newborns in the uterus, as well as genetic effects in the ovary and testis due to internal exposure to parents.
The radiosensitivity of the gonads (ovary and testis) is high compared to other tissues. The threshold for deterministic effects on the gonads is 0.4Gy/year for temporary infertility in the testicles, 2.0Gy/year for permanent infertility, and > 0.2Gy/year for infertility in the ovary. On the other hand, the tissue weighting factor (WT) is 0.08. This is the second largest after bone marrow (red), colon, lung, stomach, and breast WT (0.12; ΣWT 0.6). The radiation weighting factor (WR) of tritium beta is 1 (ref. 6).
PAR and RR showed a linear relationship with the cumulative average of tritium radioactivity concentration in the atmosphere from 5 years to less than 10 years. From this, it was considered that the stochastic effects of radiation (genetic effect) due to internal exposure to the parents of the deceased children contributed greatly.
Genetic and deterministic effects on post-pregnancy embryonic and fetal tissues were suggested by the linear correlation between post-pregnancy death and atmospheric radioactivity concentrations.
The dose-response to radiation-induced tissue reactions, malformations, and neurological effects in the uterus is said to show a dose threshold of about 100mGy or higher (ref. 6).
The linearity between the tritium radioactive concentration in the atmosphere and the effective dose due to internal exposure is unknown at this time, so we have to wait for future research. The maximum tritium radioactive concentration in 2018 is 6800mBq/L in moisture, and the cumulative annual average for 7 years is 17338 mBq/L. If the mortality rate is increased as a genetic effect, the linearity assuming an intercept of 0 in the atmospheric maximum can be explained.
The linear correlation of the cumulative annual maximum and the endpoints presented by it should lead to model construction for quantification in humans of the stochastic effects of internal exposure for safety management of radioactive waste.
____
Conclusion:
This is the first research that has been shown the finding clarified the causal relationship between environmental tritium water and its health effects when the endpoint was death in perinatal and infants, and numerically calculated the impact of stochastic effects without thresholds on public health.
The number of deaths caused by cumulative tritium since 6 years ago is 223 when multiplying by PAR (5.34%) and 260 when multiplying by PAR (6.22%). It was probably that more than 260 couples lost their children in 2018 due to tritium internal exposure over six years. The mortality cases will be continued.
Do you know how many Japanese people are sorrowful?
This is an issue that should be addressed immediately🙄. It is a deficiency in radiological☢ safety management that a strong linearity correlation between short-term (approximately 5 years) cumulative tritium radioactivity concentration and the total mortality rates👼.
To-Do;
1. Review of scientific data
2. Development of a scalable risk management system based on scientific evidence
3. Development of laws & penal regulations
4. Scalable risk management
5. Legal compliance
6. Scientific data analysis and feedback
To face life👼
____
References:
1. e-Stat https://www.e-stat.go.jp/ Statistics of Japan
e-Stat is a portal site for Japanese Government Statistics.
Regional Statistics Database (System of Social and Demographic Statistics) https://www.e-stat.go.jp/regional-statistics/ssdsview
(Engrish) https://www.e-stat.go.jp/en/regional-statistics/ssdsview
2. Ministry of Health, Labor and Welfare | Population dynamics survey> Summary of results https://www.mhlw.go.jp/toukei/list/81-1a.html Japan's population dynamics in 2018 (Trends up to 2016) https://www.mhlw.go.jp/toukei/list/dl/81-1a2.pdf
2018 (2018) Demographic Statistics Monthly Report (Approximate Number)
https://www.mhlw.go.jp/toukei/saikin/hw/jinkou/geppo/nengai18/index.html
Download Excel file
Statistical table h30toukeihyou-190626.xls Table 8 ①-Table 8 ②
3. Japanese environmental radioactivity and radiation https://kankyo-hoshano.go.jp/kl_db/servlet/com_s_index (Engrish) https://www.kankyo-hoshano.go.jp/en/index.html
Environmental Radiation Database https://search.kankyo-hoshano.go.jp/servlet/search.top
4. Japan Epidemiological Association https://jeaweb.jp/ >Basic knowledge of epidemiological terms
attributable risk and percent attributable risk http://glossary.jeaweb.jp/glossary018.html
5. Japan Atomic Energy Agency (JAEA) Nuclear Encyclopedia ATOMICA https://atomica.jaea.go.jp/
5-1. Radiation effects and radiation protection> Biological effects of radiation> Basic principles of biological effects> Biological effects of tritium (09-02-02-20|Updated March 2000) https://atomica.jaea.go.jp/data/detail/dat_detail_09-02-02-20.html
5-2. Radiation effects and radiation protection> Radioactivity in the environment> Migration and behavior in the environment> Tritium behavior in the environment (09-01-03-08|Updated August 2004) https://atomica.jaea.go.jp/data/detail/dat_detail_09-01-03-08.html
6. ICRP Publication 103
The 2007 Recommendations of the International Commission on Radiological Protection http://www.icrp.org/publication.asp?id=ICRP%20Publication%20103 The 2007 Recommendations http://www.icrp.org/docs/P103_Japanese.pdf
7. ICRP, 2012. Compendium of Dose Coefficients based on ICRP Publication 60. ICRP Publication 119. Ann. ICRP 41(Suppl.).
http://www.icrp.org/publication.asp?id=ICRP%20Publication%20119
References (※Japanese):
1. e-Stat https://www.e-stat.go.jp/ 都道府県・市区町村のすがた(社会・人口統計体系) https://www.e-stat.go.jp/regional-statistics/ssdsview
2. 厚生労働省|人口動態調査 > 結果の概要 https://www.mhlw.go.jp/toukei/list/81-1a.html 平成30年我が国の人口動態(平成28年までの動向) https://www.mhlw.go.jp/toukei/list/dl/81-1a2.pdf
平成30年(2018)人口動態統計月報年計(概数)の概況
https://www.mhlw.go.jp/toukei/saikin/hw/jinkou/geppo/nengai18/index.html
Excelファイルのダウンロード
統計表 h30toukeihyou-190626.xls 第8表①-第8表②
3. 日本の環境放射能と放射線 https://kankyo-hoshano.go.jp/kl_db/servlet/com_s_index
環境放射線データベース https://search.kankyo-hoshano.go.jp/servlet/search.top
4. 日本疫学会HP>疫学用語の基礎知識 目次
寄与危険と寄与危険割合 http://glossary.jeaweb.jp/glossary018.html
5. 原子力百科事典ATOMICA https://atomica.jaea.go.jp/
5-1. 放射線影響と放射線防護>放射線による生物影響>生物効果の基礎原理>トリチウムの生物影響(09-02-02-20|更新日2000年03月) https://atomica.jaea.go.jp/data/detail/dat_detail_09-02-02-20.html
5-2. 放射線影響と放射線防護>環境中の放射能>環境中での移行と挙動>トリチウムの環境中での挙動(09-01-03-08|更新日2004年08月) https://atomica.jaea.go.jp/data/detail/dat_detail_09-01-03-08.html
6. ICRP Publication 103
The 2007 Recommendations of the International Commission on Radiological Protection http://www.icrp.org/publication.asp?id=ICRP%20Publication%20103 The 2007 Recommendations http://www.icrp.org/docs/P103_Japanese.pdf
7. ICRP, 2012. Compendium of Dose Coefficients based on ICRP Publication 60. ICRP Publication 119. Ann. ICRP 41(Suppl.).
http://www.icrp.org/publication.asp?id=ICRP%20Publication%20119
This result supported the mechanism of linear correlation in PAR of the total mortality and the tritium radioactivity. pic.twitter.com/wcJOZ0C0BA
— MATSUNOYA.BlNt.Pharm (@Mats_blnt_pharm) November 23, 2019
薬剤師国家試験対策ノート📒
— MATSUNOYA.BlNt.Pharm (@Mats_blnt_pharm) September 10, 2019
YouTube再生リスト📺走る!「衛生」論点:#放射線👇
ループ再生🔁・シャッフル🔀を押すと、リストの動画のみを自動再生することができます。多機能で便利です🌱#薬学生📚& #薬剤師 の先生に #薬剤師国家試験 におススメ♪#薬剤師国家試験対策📣https://t.co/bezGsnhhFA
https://www.facebook.com/MATSUNOYA.BlNt.Pharm/
Yukiho Takizawa https://www.facebook.com/Yukiho.Takizawa
👉BASE
👉note
matsunoya_note | QR code https://note.com/matsunoya_note

ここから先は
¥ 100
医療、健康分野のリカレント教育における「最強コンテンツ」を note で誰でもいつでも学習できる、 https://note.com/matsunoya_note はそんな場にしたい。あなたのサポートがあれば、それは可能です。サポート感謝します!松廼屋 matsunoya