
R | ggplot | geom_bar |バーの色を変えたい

*ハイライト*
・geom_barの棒を色分けできる
・aes()で色分けするデータフレームの列名を指定する
install.packages("tidyverse")
library(ggplot2)

df <- data.frame(
  subject = c("x1", "x2", "x3", "x4", "x5", "x6"),
  weight = c(45, 53, 56, 72, 65, 50))
head(df, 2)

g <- ggplot(df, aes(x = subject, y = weight, fill = subject))+
  geom_bar(stat = "identity")
plot(g)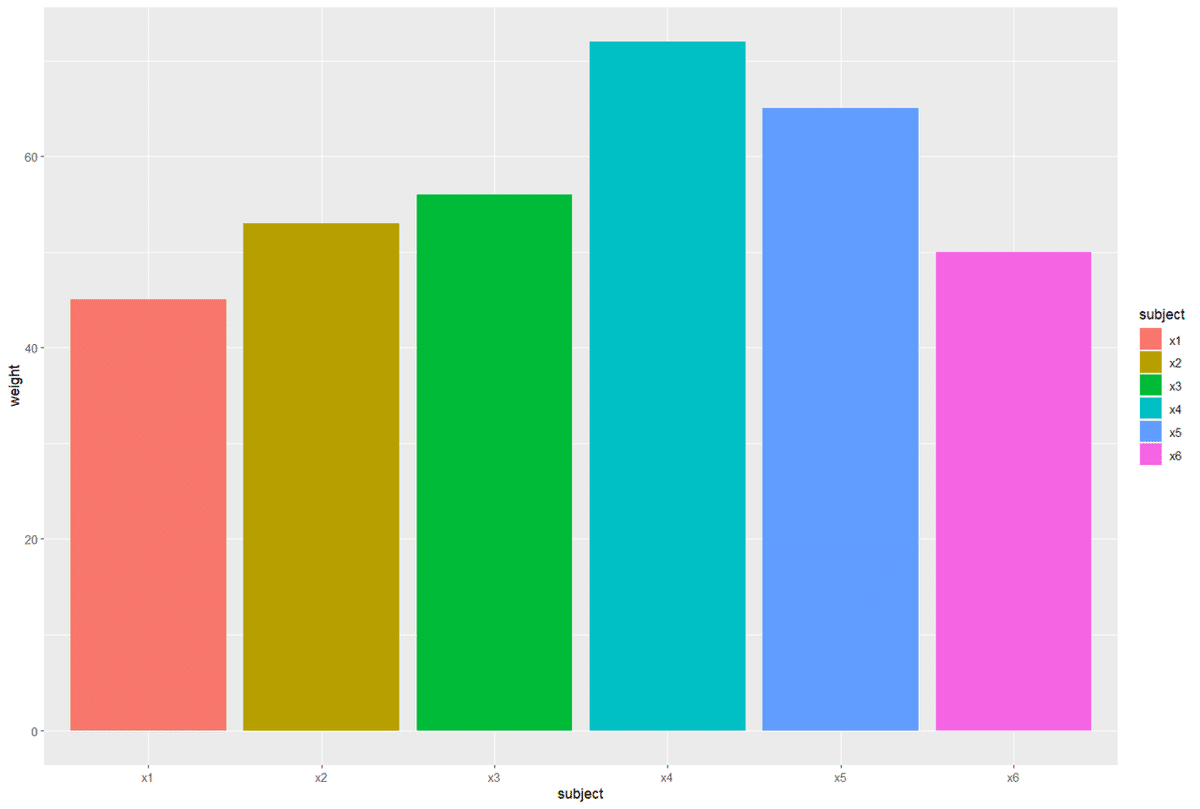
コードの説明
#パッケージのインストール
最初にパッケージをRにインストールしましょう。gglpot2はtidyverseというパッケージに内包されているので,tidyverseをインストールし,ggplot2をライブラリーします。
install.packages("tidyverse")
library(ggplot2)
#データフレームの作成
ggplotで棒グラフを作成するために被験者6人の体重を表しているデータフレームを作成します。subjectは「被験者」を,weightは「体重」を表しています。
df <- data.frame(
 subject = c("x1", "x2", "x3", "x4", "x5", "x6"),
 weight = c(45, 53, 56, 72, 65, 50))
head(df, 2)
subject weight
1 x1 45
2 x2 53
: : :
#棒グラフの描画
ggplotで被験者をX軸に,体重をY軸にマッピングし,体重の値に従って棒グラフを作成します。まずggplotのなかに使用するデータフレーム,データセットの中の変数をX軸やY軸に割り当てます。今回は体重の値をそのまま表示させたいので,geom_bar()の中身をstat = "idenetity"にしました(1)。
g <- ggplot(df, aes(x = subject, y = weight))+
 geom_bar(stat = "identity")
plot(g)
#バーに色を付ける
棒グラフのバーに色をつけるために最初に指定したggplotのエステティックの部分にバーの塗りつぶしにfillを設定します。今回は被験者ごとに色分けをしたいので,fill = subjectとします。
g <- ggplot(df, aes(x = subject, y = weight, fill = subject))+
 geom_bar(stat = "identity")
plot(g)
#エラーの出し方
もしfill = subjectをggplot内のaes外に書くと,バーが描画されなくなります。バーに色を付けたいときはaes内にfill = "色分けしたいデータフレーム列名"にしてください。
ot(df, aes(x = subject, y = weight), fill = subejct)+
 geom_bar()
plot(g)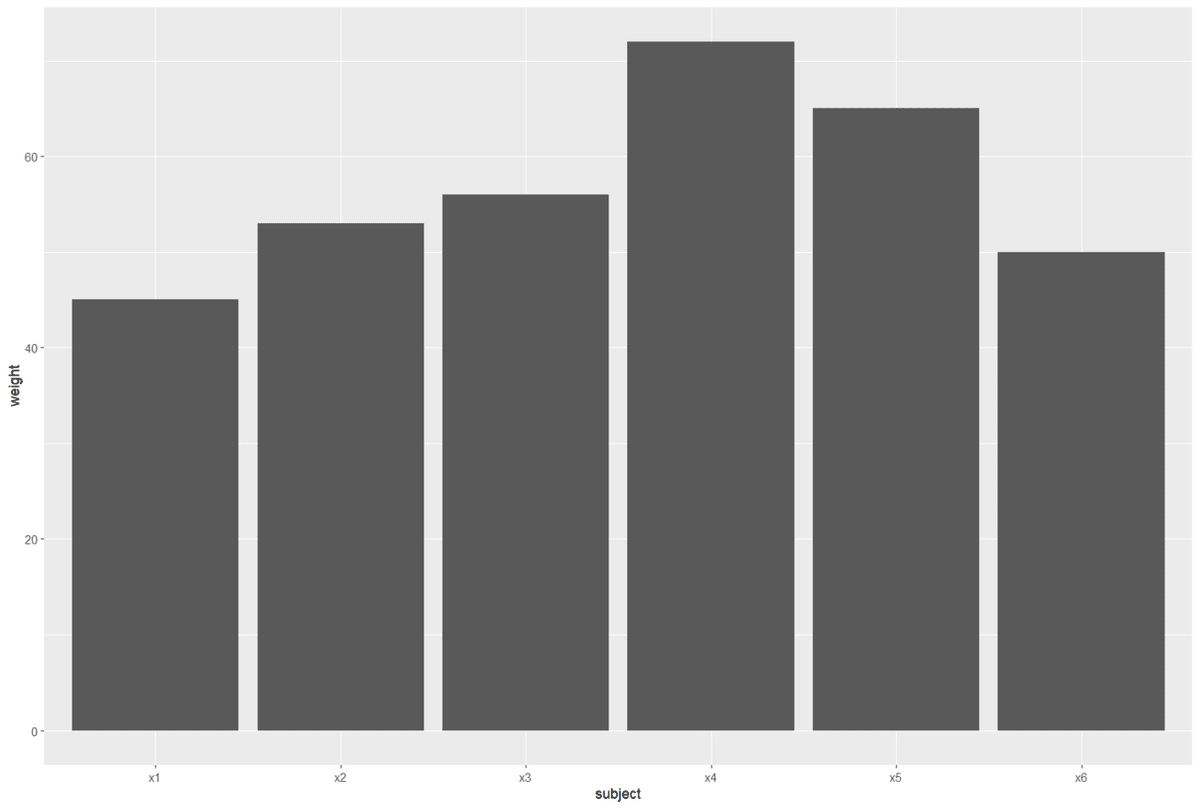
■Rグラフィックスクックブック 第2版 ―ggplot2によるグラフ作成のレシピ集/Winston Chang (著), 石井 弓美子 (翻訳), 河内 崇 (翻訳), 瀬戸山 雅人 (翻訳)
■改訂2版 RユーザのためのRStudio[実践]入門〜tidyverseによるモダンな分析フローの世界/松村 優哉 (著), 湯谷 啓明 (著), 紀ノ定 保礼 (著), 前田 和寛 (著)
■Rが生産性を高める〜データ分析ワークフロー効率化の実践/igjit (著), atusy (著), hanaori (著)
