
Photo by
takoyakiyuchan
仕事終わりの活動#3

ポンコツTKです。
昨日のKNNのグラフをラベルごとに色分けして出力するプログラムを作成したいと思うよ。
結果のグラフはこんな感じ
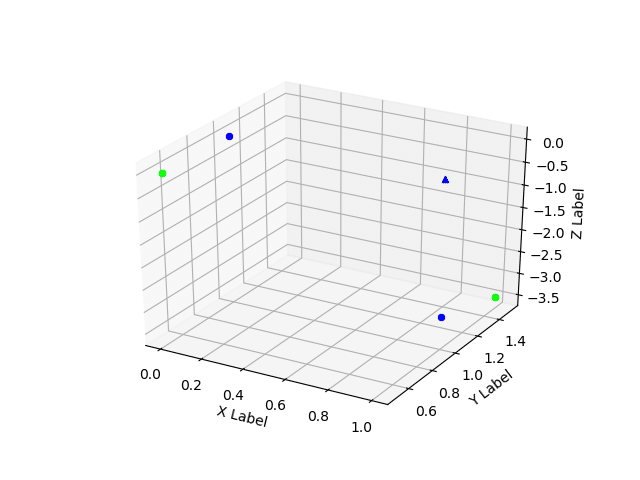
2種類に分類されたデータと1つのデータがどれに分類されるのかを視覚的に見やすくしたよ。
青と緑がデータの種類で試した1つのデータは青に分類されていることがわかるね。
プログラムは以下だよ
#!/usr/bin/env python3
# -*- coding: utf-8 -*-
import numpy as np
from matplotlib.colors import ListedColormap
from matplotlib import pyplot as plt
from sklearn.neighbors import KNeighborsClassifier
import collections
def knn(Y,samples,labels,k=2):
   print("分類されたサンプルにおいてYがどこに分類されるかをやる")
   dist =  np.sum((Y - samples)**2, axis=1)**0.5
   print("Yからの相対距離はそれぞれ",dist)
   k_labels = [labels[index] for index in dist.argsort()[:k]]
   print("相対距離が小さい順番から","k番目までを抽出すると")
   print(k_labels)
   print("重複数とともに表示すると")
   print(collections.Counter(k_labels).most_common(),"から1つだけを取り出すと")
   print(collections.Counter(k_labels).most_common(1),"からラベルを取り出すと")
   label = collections.Counter(k_labels).most_common(1)[0][0]
   print(label)

   print("よってYは",label,"に分類される")
   return label

if __name__ == '__main__':
   samples = np.array([[0., 1., 0.],\
                       [0., .5, 0.],\
                       [1., 1.5, -3.5],\
                       [1., 1., -3.]]\
                       )
   labels = np.array(['a','b','b', 'a'])
   Y = np.array([[1., 1., 0.]])
   Y_labels = knn(Y,samples,labels)
   classes, classes_index = np.unique(labels, return_inverse=True)

   cmap_keyword = "brg"
   cmap = plt.get_cmap(cmap_keyword)
   fig = plt.figure()
   ax = fig.add_subplot(projection='3d')
   n_labels = len(classes)
   for index in range(len(labels)):
       indices = np.where(classes == labels[index])[0]
       c = cmap(indices/(n_labels-1))
       x=samples[index][0]
       y=samples[index][1]
       z=samples[index][2]
       ax.scatter(x,y,z, color=c , label = labels[index])
   for index in range(len(Y_labels)):
       indices = np.where(classes == Y_labels[index])[0]
       c = cmap(indices/(n_labels-1))
       x=Y[index][0]
       y=Y[index][1]
       z=Y[index][2]
       ax.scatter(x,y,z, color=c , marker='^',label = Y_labels[index])
   ax.set_xlabel('X Label')
   ax.set_ylabel('Y Label')
   ax.set_zlabel('Z Label')
   plt.show()
実行してみてね。
おやすみなさい。
この記事が気に入ったらサポートをしてみませんか?