Internship@Harlem Link Charter School 2 -大学進学率9%の地区で-
2nd post about my internship at a charter school!
さて、今回は以前も投稿したチャータースクールのインターンについて。
1. 学校の基礎情報
前回demographyについて触れるのを忘れていたので、そこから始めたいと思います。
この学校はハーレムに位置していることもあり、97%がアフリカ系アメリカ人かヒスパニック。白人は3%、アジア人はいません。
また貧困の指数の1つであるFree or reduced price lunchの割合は90%弱と非常に高くなっています。
Let me start with the demographic, which I forgot to cover last time. African Americans and Latinos account for 97%, and white only 3% (no Asians). Moreover, the ratio of free or reduced price lunch amounts to nearly 90%.
また、3つの他の公立学校と同じ建物をシェアしているため、クラスルームが建物の中に偏在していて、迷路のようで中々分かりづらいです。。。
As this school shares the same building with three traditional public schools, it looks like a labyrinth and is quite easy to lose my way.
2. Start to Finish Projectとは?
今やっているプロジェクトですが、まず始めに、
この学校(5th gradeまで)の卒業生が通っている(いた)中学校と高校を、色々な指標に基づいて5段階にランク分けしました。
I, as an intern, first worked on categorizing middle schools and high schools that our alumni are attending / once attended based on such indicators as below.
使った指標としては、
・Graduation rate(高校 HS)
・Proficiency testのpassing rate(中学校 MS)
・安全性(教員からのアンケート from teachers)
・Post-secondary enrollment(高校 HS)
・Attendance(高校 HS)
・Teacher consideration(教員が子供の悩みにどれだけ反応してくれるか、中学校 MS)
・Support about HS application/enrollment(高校進学に当たってのサポート、中学校 MS)
といったものです。
探し方ですが、以下のようなウェブサイトがあり、各学校についてのデータが分かりやすくまとまっているので、それを基にデータを抽出し、総合スコアを見ながらランク分けをします。
How to find data? There are plenty of websites disclosing these data school by school. I created a composite variable (summation of each score) and ranked each school based on a certain criteria.
・School Quality Report
・School Finder
http://schoolfinder.nyc.gov/
・InsideSchools
ただ、これらの数字だけを見るとバイアスがかかっていたり、データがない学校もあるので、その場合には以下のランキングを代替として使いました。
When data is not available or inconsistent with our intuition, we used the niche ranking as a substitute.
そんなこんなで1週間かかり、計100以上の中学校と高校を分類し終えて第一ステップ終了です。
It took me almost one week to finish this classification of more than 100 schools.
3. ハーレムの子供の大学進学率は?
その一方、初めての卒業生(2010年)がちょうど高校を今年卒業するので、その最新のデータを触らせてもらいました。
聞いたところによると、ハーレムの子供の大学進学率は、なんとたったの9%。
その中でこの学校の卒業生の大学進学率は31%(現時点、さらに増える可能性あり)なので、卒業後のきめ細かいケアがしっかりと実っていると言えるのではないでしょうか。
On the other hand, I analyzed data about the students who first graduated from Harlem Link in 2010. Only 9% of students in Harlem made their way through college, so our results of 31% is somewhat promising (maybe because of a continuous support even after graduation).
4. 待望(?)の授業見学
データ処理にそろそろ疲れたな・・・と思ったころ、
上司が「毎日classroomにpop inしてきて良いよ」と積極的に声をかけてくれました!!
My director kindly encouraged me to visit classroom every day!
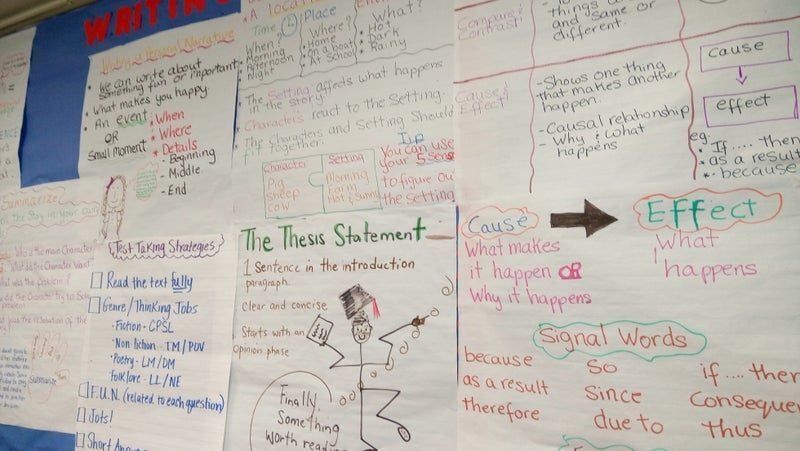
こちらは3rd Graderのクラス。
左の方にあるtesting strategiesがリアルですね(3年生から州のテストが始まります)。
This is 3rd Grader classroom, with "testing strategies" as this is the grade when state test starts.

また、先週は社会科で中国について学んでいたということで、私のSIPAとTCの中国人のクラスメートをここに呼んで授業をしてもらいました!
子供達もやはり実際にその国の人が目の前にいるので、とても興味を持ったのか次々に質問を浴びせかけていました。
Because this social study class studies China, I invited two of my Chinese friends at SIPA and TC to have a lecture. Students looked so excited and inquisitive, and asked so many questions to the guest speaker.

こちらはChinese Knotを自分で書く練習をしてもらいました。ユニークな形や色使いが出てきて見ていて楽しかったです!
Also they learned how to draw a Chinese knot. Every student has different shape and color preferences!

次回の投稿ではプロジェクトの2つ目の内容と、後教室を見て感じたことについて書きます!
Next time I'll explain the content of 2nd project and my reflection on classroom observation!
(※本記事は、2017年6月時点の投稿をリメイクしたものです。)
この記事が気に入ったらサポートをしてみませんか?
