
【投資初心者向け】新NISA向け割安株を見つけよう!⑤(Let's find valuable stocks in Japanese stock market⑤: for beginners)

みなさんこんにちは!年収300万円会社員投資家の「とある投資家」です!
ここまでの記事を読んでいただいた方、ご興味を持っていただけた方、スキをいただいた方、本当にありがとうございます!励みになりますしとても嬉しいです😊🙌
さて、ここまでのお話は、
①年収300万円会社員の私が会社四季報を読んで株式投資の銘柄
を探し、
②34%の運用益の達成ができた(可能性がある)こと、
それに加えて
③PER,PBRと上向きチャートを意識した選抜、いわゆる”1軍リスト”を作成したこと
そしてその
④1軍リストがまたも20%の運用益が出ていた可能性があること
についてお話してきました!👏👏👏
素人投資家の私もなかなかのものでしたね~😎

さて、ここまでの話の中では、日本の上場企業の中から、③でご紹介したポイントを踏まえると優良銘柄を見つけることが可能であることがわかりましたね☺️✌️
しかし、こちらをご覧ください!🤔

こちらは1軍リスト中にある1871PS三菱という会社です。私は昨年5月の1株692円の時にこの銘柄に目を付けました。
一時は1株1095円まで上昇しましたが、おとといは998円となり下がってしまいました…😇
つまり100株買っていた際には約+40000円→+30000円と、最高値から10000円ほど下がってしまっています…😭😭
あー、あの高値の時に売っておけばなぁ…
そう誰もが思うはずですが、これがなかなか難しい…😫
ということで今回の記事では、どのタイミングで利益を確定するべきかについてご紹介いたします!☺️☺️☺️👏👏👏
まずこちらのルールを考えました!
①移動平均線パターン
です!

移動平均線とは、任意の期間の株価の平均値(私は5日:青、50日:オレンジ、100日:赤で今回は設定しています)をつないで線にしたものです。↗️
そして、私はポイントの注目します、それはここです!🈁🈁🈁

この青の線とオレンジの線が交わったところに注目しましょう!
その後一時グーっと下がって、少し持ち直したもののまた現在は下がり局面です…😫
この時に売却できた場合、今よりも+3000円の利益を上げることができましたね!✌️
こういう銘柄では、この短期の移動平均線と中長期の移動平均線が下向きに交差したいわゆるデッドクロスが発生したときに手放してしまうことで利益を確定させることが可能です!🧐
ただし、個人的な感想としては、まだこの銘柄の株価は100日線まで下りてきていませんので、長期で見れば上昇中と見ることができます!
ですので、焦って手放さず、のんびり持っているのも選択肢の一つかもしれませんね~😎
さて、もう一つのパターンがあります、それがこちら!

こちらは2292S FOODSという会社ですが、一時は3575円を付けたものの、また3000円を下回ってしまっています…😭
この会社ではここに注目しましょう、どんっ💥
②4日連続パターン
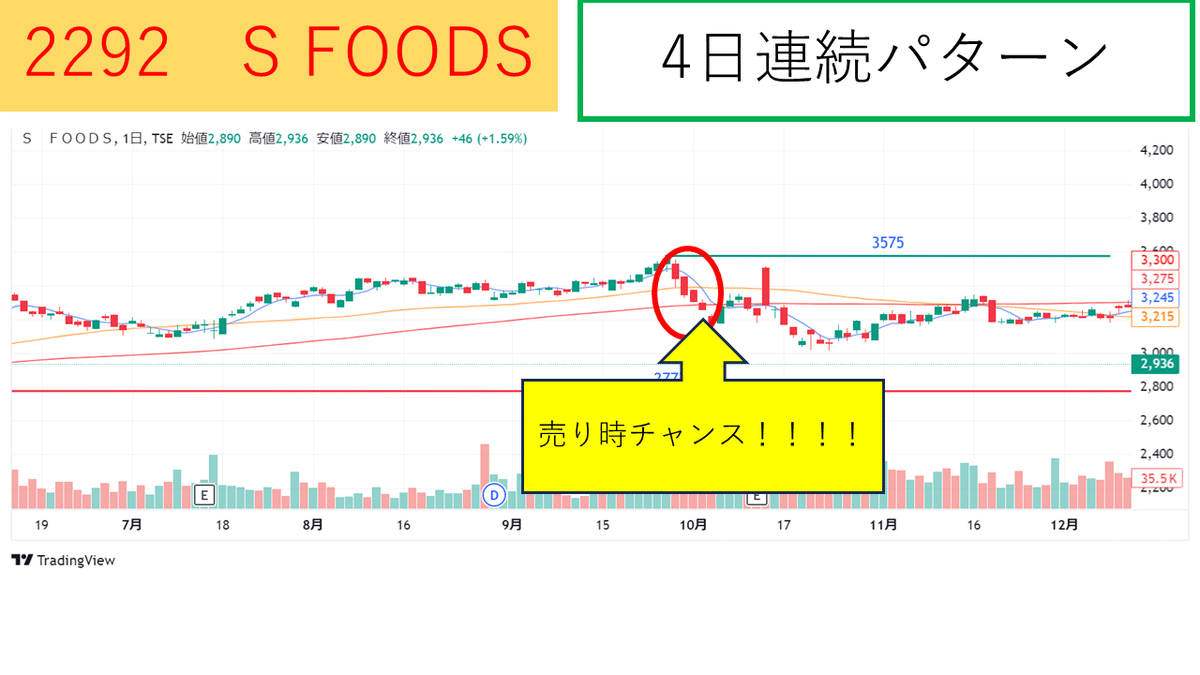
4日連続で株価が下がったタイミングがありますね!(しかも移動平均線パターンも併発しています…)
ここで5日目に手放してた場合は、それでも3175円ですので100株にすると今よりも約20000円高値で売れていたことになります!🤞
私の勝手な感覚ですが、4日連続で上がる、もしくは下がるという事象が発生した場合はそれぞれ上昇と下降のトレンドに変化していることが多いように思います🤔🤔🤔
ですので、高値を目指して株価が上昇していた銘柄がある週に4日連続で終値が下がった場合はそこからさらに下がっていく可能性がありますので、その理論で利益を確定してみましょう😎
しかもこれらの方法のいいところは、終値に注目してみていけばいいところです😃✨✨
私たちのように普段は会社で仕事をしていて株価をずっと見ていられない会社員投資家やお忙しい方々には、株式市場が休みの時間帯に評価して判断できるのでオススメです😁(瞬時の判断はできませんので少し利益を最大化できない場合がありますが、瞬時の判断はまたときに間違いを起こすことも多いのではないでしょうか…😂😂😱😱)
この二つのパターンのどちらかを満たした場合に株を売却するという方法をとればそれなりに高いうちに利益を確定できるのに加えて、逆に購入の際にもトレンドを見極めるいい指標になりますね😋😋😋
しかし、私もまだここがうまくできませんので、皆さんと一緒に勉強していきたいと思います!!!😂😂😂🤣🤣🤣
次回は、このルールにのっとっていた場合、1軍リストの銘柄の利益はどのように確定できたのかそれぞれの銘柄を振り返っていきたいと思います!☺☺
それでは、また次回お会いしましょう、読んでいただきありがとうございました🙏🙏🙏
Hello everyone! I’m ‘An Investor’, a company employee with an annual income of 3 million yen! Thank you so much to those who have read my articles so far, those who have taken an interest, and those who have liked them! It’s very encouraging and I’m very happy 😊🙌
So far, I’ve talked about how:
① I, a company employee with an annual income of 3 million yen, read the company’s Shikiho and searched for stock investment brands,
② I was able to achieve a return on investment of 34% (potentially), In addition to that,
③ I created a so-called “first team list” that was conscious of PER, PBR, and upward charts, And that
④ there was a possibility that the first team list could also have a return on investment of 20%.
I, an amateur investor, was quite something, wasn’t I? 😎
In the story so far, we’ve seen that it’s possible to find good stocks from among Japan’s listed companies, taking into account the points I introduced in ③ ☺️✌️
But take a look at this! 🤔
This is a company called 1871PS Mitsubishi, which is on the first team list. I spotted this stock when it was 692 yen per share in May last year.
At one point it rose to 1095 yen per share, but the day before yesterday it fell to 998 yen… 😇
So if you had bought 100 shares, you would have made about +40000 yen → +30000 yen, but it has fallen by about 10000 yen from the highest price… 😭😭
Ah, I wish I had sold at that high price… I’m sure everyone thinks that, but it’s quite difficult… 😫
So in this article, I’m going to introduce when you should realize your profits! ☺️☺️☺️👏👏👏
First, I thought about this rule!
① Moving average line pattern
That’s it!
The moving average line is a line that connects the average stock price for any period (I have set it to 5 days: blue, 50 days: orange, 100 days: red this time). ↗️
And here’s the point I’m focusing on, it’s here! 🈁🈁🈁
Let’s focus on where this blue line and orange line intersect! After that, it went down for a while, recovered a little, but now it’s in a downward phase again… 😫
If you could have sold at this time, you could have made a profit of +3000 yen more than now! ✌️
In such stocks, it is possible to realize profits by letting go when a so-called dead cross occurs, where the short-term moving average line and the medium-to-long-term moving average line intersect downward! 🧐
However, personally, the stock price of this stock has not yet fallen to the 100-day line, so if you look at it in the long term, you can see that it is on the rise! So, it might be one of the options to hold on without rushing and relax~ 😎
Now, there’s another pattern, and that’s this!
This is a company called 2292S FOODS, but although it once hit 3575 yen, it has fallen back below 3000 yen again… 😭
Let’s focus on this in this company, here it is, boom 💥
② 4-day consecutive pattern
There’s a timing when the stock price fell for 4 consecutive days! (And the moving average line pattern is also occurring…) If you had let go on the 5th day, it would still be 3175 yen, so if you make it 100 shares, you could have sold it at about 20000 yen higher than now! 🤞
It’s just my arbitrary feeling, but I often think that when an event of rising or falling for 4 consecutive days occurs, it often changes to either an upward or downward trend respectively 🤔🤔🤔
So, if a stock that was aiming for a high price and was rising in stock price falls at the end of the week for 4 consecutive days, there is a possibility that it will continue to fall from there, so let’s realize profits with that theory 😎
And the good thing about these methods is that you just need to focus on the closing price 😃✨✨
For company employee investors like us who are usually working at a company and can’t always look at stock prices, and for busy people, it’s recommended because you can evaluate and judge during the time when the stock market is closed 😁 (You can’t make instant judgments, so you may not be able to maximize profits a little, but instant judgments often cause mistakes, don’t they… 😂😂😱😱)
If you sell stocks when either of these two patterns are met, you can realize profits while they are relatively high, and on the contrary, when buying, they can be a good indicator to discern the trend 😋😋😋
However, I still can’t do this well, so I want to study with everyone!!! 😂😂😂🤣🤣🤣
Next time, I want to look back at each stock on the first team list and see how I could have realized profits if I had followed this rule! ☺☺
So, see you next time, thank you for reading 🙏🙏🙏