PythonとGoogle Spreadsheetで家庭菜園の収穫管理 ~ (後) 集計編

前回でGoogle Spreadsheetへのアクセスが出来るようになったので、今回は実際にシートから収穫高を集計していくよ。
前編はこちら
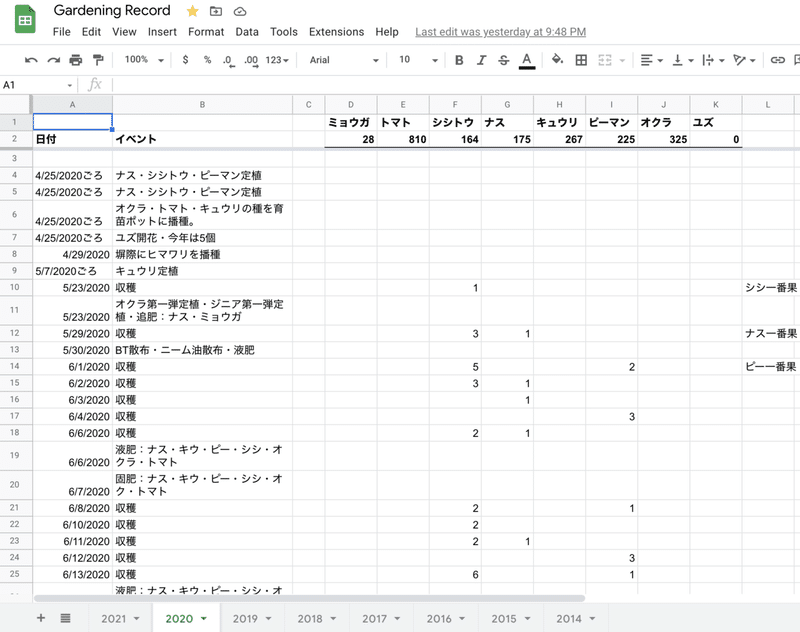
スプレッドシートのフォーマット
まずは各シートのフォーマットを確認
・シート名は年を4ケタで
・1行目:野菜の種類を列挙
・2行目:見出しなどに使い収穫高は書き込まない。シート上で総計を計算したりしている
・3行目以降:A列に日付、野菜の列に収穫高。
こんな感じで、収穫がないとき、欄外は好きなようにメモを書いて良し
コード1:準備
ライブラリとフォントプロパティを準備。
from __future__ import print_function

import gspread

import datetime
import os
import numpy as np
import matplotlib.pyplot as plt
from matplotlib.ticker import AutoMinorLocator
from matplotlib.font_manager import FontProperties

# for Mac
font_path = '/Users/unamuni/Library/Fonts/ipagp.ttf'
font_path2 = '/System/Library/Fonts/Supplemental/Arial.ttf'

fp1 = FontProperties(fname=font_path, size=12)
fp2 = FontProperties(fname=font_path, size=10)
fp3 = FontProperties(fname=font_path2, size=10)
コード2:クラウドに接続
所望のスプレッドシートにシートIDを使って接続。シートIDはスプレッドシートのURLから切り出してくる。アクセスエラーが出るときは期限切れかもしれないので、authorized_user.jsonを削除し、再度gspread.oauth()する。(2021/8/1改修)
# Establish the connection
sheet_ID = '1CkMkNzgFIZRT6B-eq1mEWkOWcp54bdZI_yBFxZAou0o'

try:
   sh = gsh_conn.open_by_key(sheet_ID)
   # Obtain all the sheet object in a list
   worksheet_list = sh.worksheets()
except:
   print('Removing JSON file')
   fpath='~/.config/gspread/authorized_user.json'
   fname= os.path.expanduser(fpath)
   if os.path.isfile(fname):
       os.remove(fname)

   gsh_conn  = gspread.oauth()
   sh = gsh_conn.open_by_key(sheet_ID)
   # Obtain all the sheet object in a list
   worksheet_list = sh.worksheets()
コード3:シートのセル値を全部落としてくる
シートの内容を全部メモリに落としてしまえば、クラウドの事は忘れる事ができるのです。
・gspreadライブラリのworksheets()はスプレッドシートの全シートをsheet objectのリストとして生成。←これは前節のworksheet_list = sh.worksheets()で実行。
・for文:シートオブジェクト一個一個を巡回して処理。処理では各シートをwsとして扱う。
・シート名が非負整数だったら(isnumeric がtrue)、シート名を整数に変換したものをyr_listに追加。最終的にはyr_listに各年のリストが並ぶ。
・get_all_values()でデータを全部落とす。このときcell_valuesは{}で定義しているのでDict型になり、cell_values[ws_title]は自動的に生成されて、そこにデータが入る。(引数は文字列じゃなく整数にすれば良かったかも)
yr_list=[]
cell_values={}

for ws in worksheet_list:
   ws_title=ws.title
   if ws_title.isnumeric(): # If the worksheet title is non-negative integer
       # All the sheet cell values goes into the dictionary.
       cell_values[ws_title]=ws.get_all_values()
       # and the sheet title (=year) goes into a list
       yr_list.append(int(ws_title))
コード4:各年のデータを処理
これはちょっと大変だが、以下の方針でやる。
・集計結果は「yyyy年のナスの各月の収穫高」のリストという形で見られるようにしたい。
・最終結果がresultというDict変数に入っていて、各年の結果は"2018"などで参照できるようにする。
・各年の結果から各野菜の収穫高リストを得るには、野菜の名前で参照できるようにする。
このようにネストしたdictをつかえば、シート側で野菜の順番が入れ替わったりしても、集計結果に影響が生じない。
・処理の開始年と終了年はユーザー入力として定義。
・Dict型変数resultを空{}で定義して、器だけ作っておく。
・for yrで開始年から終了年前をループ。以下ループ内の処理
・valにyrで指定されたシートのセール値を全コピー。そのシートがなかったらどうする?そういうのを処理しないと行けない場合はtryを使わないと…
・1行目すなわちval[0]に野菜の種類が列挙されている。これをcategoryへ取り込む。
・3行目から最後までをざっとスキャンして、日付文字列のリストをdate_listに取り込む。
・yr_resultはfor veg_cnt in ...の中で構築するよ
・最後にresult[yr]=yr_resultで最終結果に各年の結果を登録する。
start_yr=2018
end_yr=2020
result={}

for yr in range(start_yr,end_yr+1): # loop from stat_yr to end_yr
   print('Now processing: Year', yr)

   # all cells of the sheet
   val = cell_values[str(yr)]

   # the first line is the vegetable category
   category = val[0]
   #print('Category List:',val[0])

   # date list start from A3 to the bottom of A
   date_list = [r[0] for r in val[2:]]

   # prepare an empty dict for result summary
   yr_result={}

   # loop through categories
   for veg_cnt in range(len(category)):
      ....


   # now we have the result of all the vegetables for this year
   # add it to the result dict
   result[yr]=yr_result
   print('')
   print('')
では各年の処理の部分はというと、
・veg_cntはいま何列目を処理しているかが分かるよう、数値的に回るようにする。
・今どの野菜を扱っているかをvegに入れる。
・vegは空白かも知れないから、そしたらその列は無視する。
・さっき作った日付のリストと対応する、この野菜の収穫高のリストをharvest_listとして作成
・0で埋められたharvest_arrayを27ヶ月分準備。ただし、0月からスタートすると見なす。(リストの引数と月が整合するように)
・harvest_listを上から巡回して、値が非負整数(isnumeric true)だった場合、その値を対応する月の箱に追加する。
・時刻はdatetime.strptimeで文字列からdatetimeオブジェクトに変換しておく。月や年が扱いやすいので。
・この野菜の集計が終わったら、 yr_result[veg]=harvest_arrayでこの年の結果に登録
   # loop through categories
   for veg_cnt in range(len(category)):

       # veg is the category I am working on
       veg=category[veg_cnt]

       # veg can not be empty
       if veg!='':
           # veg exists

           # print which column and veg we are working on
           print(veg_cnt,veg,' ',end='')

           # extract the row for this vegetable from row #2 to the end (=skip top 2 rows)
           harvest_list=[r[veg_cnt] for r in val[2:]]

           # prepare an empty dict for the result summary of this vegetable
           # the first element is for the month 0 -> never used
           # the second element is for Jan of this year
           harvest_array = np.zeros(12*2+2+1)

           # loop through all the element (row) of the harvest_list
           for harvest_cnt in range(len(harvest_list)):

               # check if this row has a non-negative integer number
               if harvest_list[harvest_cnt].isnumeric():

                   # if so, get that int number
                   harvest_num=int(harvest_list[harvest_cnt])

                   # convert date string into a datetime object
                   dt=datetime.datetime.strptime(date_list[harvest_cnt], '%m/%d/%Y')

                   # and extract the month (+12 months for the 2nd year)
                   mth=dt.month+(dt.year-yr)*12

                   # remember Jan is mth=1, ... mth=0 is never used
                   # print(mth,harvest_list[harvest_cnt]) # for DEBUG
                   # add the harvest to the corresponding month
                   harvest_array[mth]=harvest_array[mth]+harvest_num

           #print(harvest_array) # for DEBUG

           # now we have the result of this vegetable for this year
           # add it to the result dict of this year
           yr_result[veg]=harvest_array
例えば結果には
# example トマト for 2018
result[2018]['トマト']
と言う形式でアクセスできる。
コード5:結果のプロット
ようやくグラフィクスまで来た!
・plot_categoryで指定された野菜をこの順番でプロットする。subplot8つ(タテ2xヨコ4)を変数spで巡回していく。
・横軸の月は各月データの長さから逆算出する。このときrangeをつかうと最初は0になるので、ここで0月から始まるように集計していた事が生きる。
・プロットした結果はPDFとPNGでセーブする。
plot_category=['キュウリ','ナス','ピーマン','シシトウ','トマト','ミョウガ','オクラ']
fig = plt.figure(figsize=(15,10),dpi=200)
sp=1
col=['r','b','g','k']
for cat in plot_category:
ax=plt.subplot(2,4,sp)
sp=sp+1
for yr in range(start_yr,end_yr+1):
yr_result=result[yr]
try:
yr_veg_harvest=yr_result[cat]
mths=np.array(range(len(yr_veg_harvest)))
plt.fill_between(mths, yr_veg_harvest, step='mid',color=col[yr-start_yr],alpha=0.3)
plt.plot(mths, yr_veg_harvest, drawstyle='steps-mid',linewidth=1,color=col[yr-start_yr],
label=('%d: %d' u'個') % (yr,int(sum(yr_veg_harvest))))
except:
print('Year',yr, cat,'not found')
plt.title(cat,fontproperties=fp1)
plt.ylabel(u'個', fontproperties=fp2)
plt.xlabel(u'月', fontproperties=fp2)
plt.xticks(np.arange(1, 27, step=2),np.mod(np.arange(1, 27, step=2),12), fontproperties=fp3)
plt.yticks(fontproperties=fp3)
plt.xlim(1,26)
plt.grid(True)
plt.legend(prop=fp2)
ax.xaxis.set_minor_locator(AutoMinorLocator(2))
ax.tick_params(axis='both',which='both',direction='in')
fig.savefig('gardening18_20.png', bbox_inches='tight')
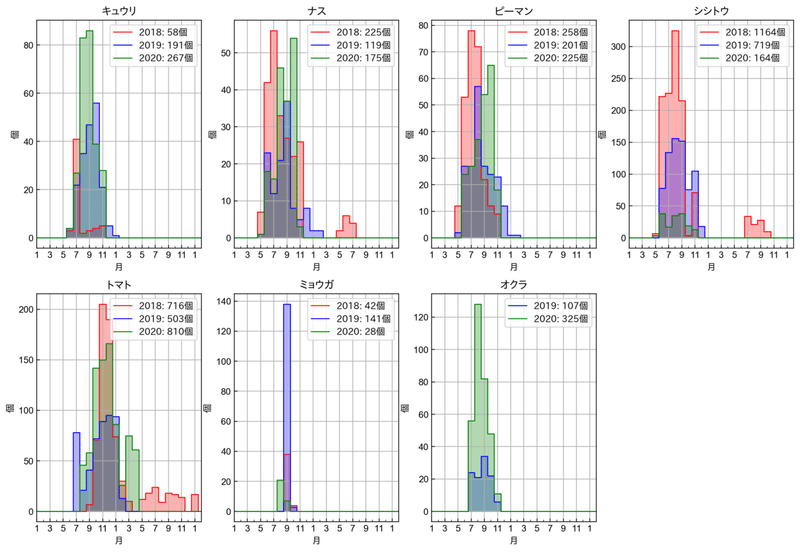
fig.savefig('gardening18_20.pdf', bbox_inches='tight')仕上がり
プロットはこんな感じ。ほうほう。トマト(ミニトマト)は当地では夏には全く実が付かず、涼しくなってくる10~11月頃からの収穫になるようだ。ナス・ピーマン・シシトウはおよそ6月から11月が結実期。ミョウガは9月にガッと収穫できて、それでもう終わり。
全コード
認証部分2021/7/4追記
#!/Users/unamuni/opt/anaconda3/bin/python


from __future__ import print_function

import gspread

import datetime
import numpy as np
import matplotlib.pyplot as plt
from matplotlib.ticker import AutoMinorLocator
from matplotlib.font_manager import FontProperties

# for Mac
font_path = '/Users/unamuni/Library/Fonts/ipagp.ttf'
font_path2 = '/System/Library/Fonts/Supplemental/Arial.ttf'

fp1 = FontProperties(fname=font_path, size=12)
fp2 = FontProperties(fname=font_path, size=10)
fp3 = FontProperties(fname=font_path2, size=10)

# Establish the connection
sheet_ID = 'YOUR SHEET ID HERE'

try:
   sh = gsh_conn.open_by_key(sheet_ID)
   # Obtain all the sheet object in a list
   worksheet_list = sh.worksheets()
except:
   print('Removing JSON file')
   fpath='~/.config/gspread/authorized_user.json'
   fname= os.path.expanduser(fpath)
   if os.path.isfile(fname):
       os.remove(fname)

   gsh_conn  = gspread.oauth()
   sh = gsh_conn.open_by_key(sheet_ID)
   # Obtain all the sheet object in a list
   worksheet_list = sh.worksheets()

yr_list=[]
cell_values={}

for ws in worksheet_list:
   ws_title=ws.title
   if ws_title.isnumeric(): # If the worksheet title is non-negative integer
       # All the sheet cell values goes into the dictionary.
       cell_values[ws_title]=ws.get_all_values()
       # and the sheet title (=year) goes into a list
       yr_list.append(int(ws_title))

start_yr=2018
end_yr=2020
result={}

for yr in range(start_yr,end_yr+1): # loop from stat_yr to end_yr
   print('Now processing: Year', yr)

   # all cells of the sheet
   val = cell_values[str(yr)]

   # the first line is the vegetable category
   category = val[0]
   #print('Category List:',val[0])

   # date list start from A3 to the bottom of A
   date_list = [r[0] for r in val[2:]]

   # prepare an empty dict for result summary
   yr_result={}

   # loop through categories
   for veg_cnt in range(len(category)):

       # veg is the category I am working on
       veg=category[veg_cnt]

       # veg can not be empty
       if veg!='':
           # veg exists

           # print which column and veg we are working on
           print(veg_cnt,veg,' ',end='')

           # extract the row for this vegetable from row #2 to the end (=skip top 2 rows)
           harvest_list=[r[veg_cnt] for r in val[2:]]

           # prepare an empty dict for the result summary of this vegetable
           # the first element is for the month 0 -> never used
           # the second element is for Jan of this year
           harvest_array = np.zeros(12*2+2+1)

           # loop through all the element (row) of the harvest_list
           for harvest_cnt in range(len(harvest_list)):

               # check if this row has a non-negative integer number
               if harvest_list[harvest_cnt].isnumeric():

                   # if so, get that int number
                   harvest_num=int(harvest_list[harvest_cnt])

                   # convert date string into a datetime object
                   dt=datetime.datetime.strptime(date_list[harvest_cnt], '%m/%d/%Y')

                   # and extract the month (+12 months for the 2nd year)
                   mth=dt.month+(dt.year-yr)*12

                   # remember Jan is mth=1, ... mth=0 is never used
                   # print(mth,harvest_list[harvest_cnt]) # for DEBUG
                   # add the harvest to the corresponding month
                   harvest_array[mth]=harvest_array[mth]+harvest_num

           #print(harvest_array) # for DEBUG

           # now we have the result of this vegetable for this year
           # add it to the result dict of this year
           yr_result[veg]=harvest_array


   # now we have the result of all the vegetables for this year
   # add it to the result dict
   result[yr]=yr_result
   print('')
   print('')

# example トマト for 2018
# result[2018]['トマト']

plot_category=['キュウリ','ナス','ピーマン','シシトウ','トマト','ミョウガ','オクラ']

fig = plt.figure(figsize=(15,10),dpi=200)

sp=1
col=['r','b','g','k']

for cat in plot_category:

   ax=plt.subplot(2,4,sp)
   sp=sp+1

   for yr in range(start_yr,end_yr+1):
       yr_result=result[yr]

       try:
           yr_veg_harvest=yr_result[cat]
           mths=np.array(range(len(yr_veg_harvest)))

           plt.fill_between(mths, yr_veg_harvest, step='mid',color=col[yr-start_yr],alpha=0.3)
           plt.plot(mths, yr_veg_harvest, drawstyle='steps-mid',linewidth=1,color=col[yr-start_yr],
                    label=('%d: %d' u'個') % (yr,int(sum(yr_veg_harvest))))

       except:
           print('Year',yr, cat,'not found')


   plt.title(cat,fontproperties=fp1)
   plt.ylabel(u'個', fontproperties=fp2)
   plt.xlabel(u'月', fontproperties=fp2)
   plt.xticks(np.arange(1, 27, step=2),np.mod(np.arange(1, 27, step=2),12), fontproperties=fp3)
   plt.yticks(fontproperties=fp3)
   plt.xlim(1,26)
   plt.grid(True)

   plt.legend(prop=fp2)

   ax.xaxis.set_minor_locator(AutoMinorLocator(2))
   ax.tick_params(axis='both',which='both',direction='in')

fig.savefig('gardening18_20.png', bbox_inches='tight')
fig.savefig('gardening18_20.pdf', bbox_inches='tight')この記事が気に入ったらサポートをしてみませんか?