ログイン
会員登録
dataviz
書いてみる
関連タグ
#Tableau (4,438)
#データ (29,785)
#30DayChartChallenge (3)
#Climate (43)
#DataFam (15)
#GIS (534)
人気
急上昇
新着
定番
有料のみ
7件
人気の記事一覧
独学でデータ可視化を学ぶ方法:⓶学習リソース編(ブログ、コミュニティ、X)
ホヴィンチ|3つの視点
5か月前
10
Tableau|自002_宇宙時計 - Clock of universe
yuko.n
3か月前
3
石川、富山、新潟のワイナリー Wineries in Ishikawa, Toyama, Niigata
Yuta Kanzawa
6か月前
9
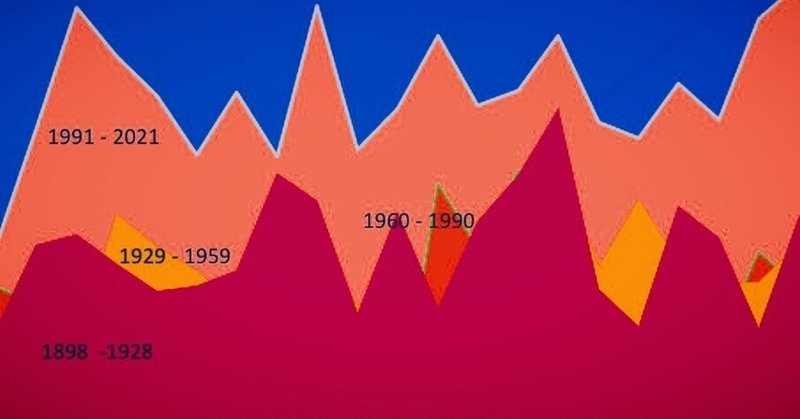
日本の気温を風景画風に描いてみた
shiro
1年前
15
#30DayChartChallengeに30日間毎日取り組んで完走した感想
まりーな/エンジニア
2年前
10
左派ポピュリズムに騙されるな
Prof. Nemuro🏶
4年前
22
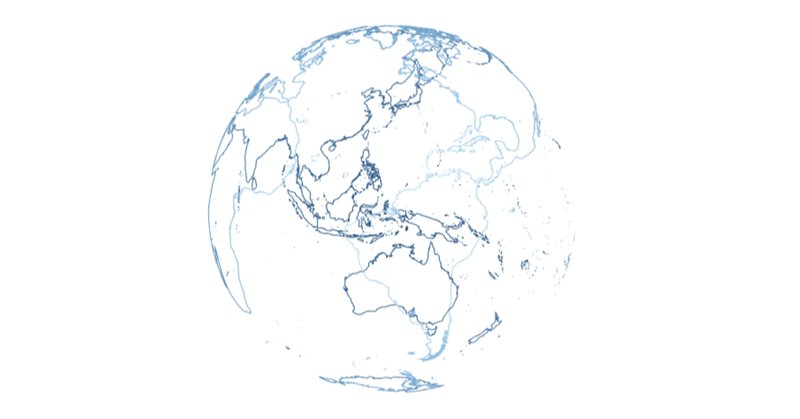
Data set and explanation about drawing coastline on the earth with Tableau (used in the viz "Volcanoes on the earth")
ritz_Tableau | Satoshi Ganeko
4年前
8