
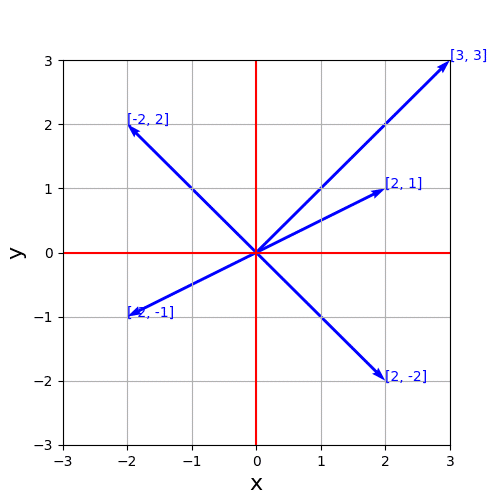
Python(ベクトル描画)

下記の画像を描画するコードを共有致します。
# ベクトルの描画
import numpy as np
import matplotlib.pyplot as plt
# 5×5サイズのFigureを作成してAxesを追加
fig = plt.figure(figsize=(5,5))
ax = fig.add_subplot(111)
# グリッド表示
ax.grid()

# 軸ラベル設定
ax.set_xlabel("x", fontsize = 16)
ax.set_ylabel("y", fontsize = 16)

# 軸範囲設定
ax.set_xlim(-3, 3)
ax.set_ylim(-3, 3)

# x軸とy軸
ax.axhline(0, color = "red")
ax.axvline(0, color = "red")

# ベクトル表示
# quiver(始点x, 始点y, 終点x, 終点y)
ax.quiver(0, 0, 2, 1, color = "blue",
       angles = 'xy', scale_units = 'xy', scale = 1)
ax.quiver(0, 0, 3, 3, color = "blue",
       angles = 'xy', scale_units = 'xy', scale = 1)
ax.quiver(0, 0, 2, -2, color = "blue",
       angles = 'xy', scale_units = 'xy', scale = 1)
ax.quiver(0, 0, -2, -1, color = "blue",
       angles = 'xy', scale_units = 'xy', scale = 1)
ax.quiver(0, 0, -2, 2, color = "blue",
       angles = 'xy', scale_units = 'xy', scale = 1)

# ベクトルにテキストを添える
ax.text(2, 1, "[2, 1]" , color = "blue", size = 10)
ax.text(3, 3, "[3, 3]" , color = "blue", size = 10)
ax.text(2, -2, "[2, -2]" , color = "blue", size = 10)
ax.text(-2, -1, "[-2, -1]" , color = "blue", size = 10)
ax.text(-2, 2, "[-2, 2]" , color = "blue", size = 10)
plt.savefig('ベクトル描画.png') # 画像として保存
plt.show()
上記のコードになります。
この記事が気に入ったらサポートをしてみませんか?