Strava/Withings Web API開発 - まとめ

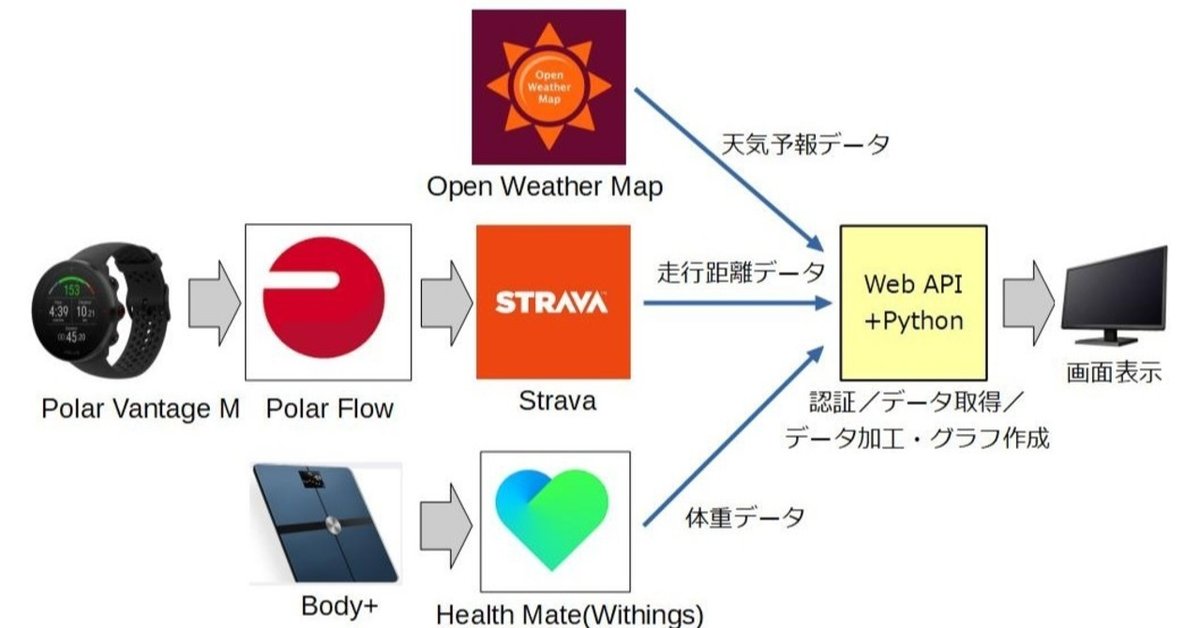
それぞれのサービス毎にデータ取得と画面表示ができたので、1つのモジュールに纏めて同じ画面に表示してみた。
画面レイアウト
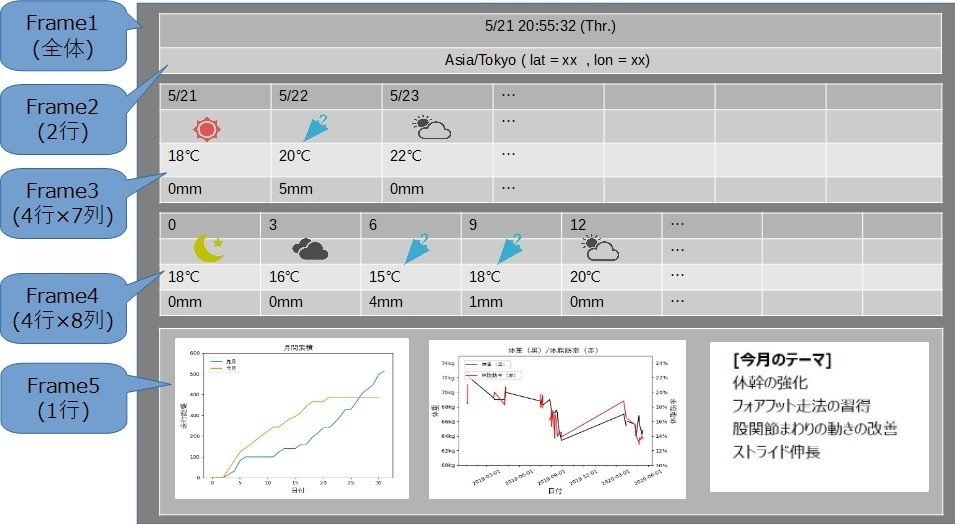
画面レイアウトは以下の通り。幅の自動調整など融通が利くように5つのフレームでの構成としました。
モジュール構成
以下の通り3つのモジュール構成としました。
・メインモジュール:
OpenWeather_Strava_Withings.py
・メインモジュールからimportされるモジュール
- Strava_RefreshToken.py
(Strava用Refresh Tokenモジュール)
- Withings_RefreshToken.py
(Withings用Refresh Tokenモジュール)
また、メインモジュールの内部構成は以下の通り。
①各種パッケージのimport
②各種パラメーター設定
③関数の定義
- createTimeFrame
(時刻表示フレーム作成)
- updateTime
(時刻設定)
- createOpenWeatherDailyFrame
(天気予報(日次)フレーム作成)
- updateDailyWeather
(天気予報(日次)データ取得)
- createOpenWeather3HourFrame
(天気予報(3時間毎)フレーム作成)
- update3hourWeather
(天気予報(3時間毎)データ取得)
- updateStrava
(Stravaデータ取得/グラフ作成)
- updateWithings
(Withingsデータ取得/グラフ作成)
- updateMonthlyTheme
(月間走行距離/月次テーマ表示設定)
④メインウィンドウ作成、フレーム作成、以下を実行
- createTimeFrame
- updateTime
- createOpenWeatherDailyFrame
- updateDailyWeather
- createOpenWeather3HourFrame
- update3hourWeather
- updateStrava
- updateWithings
- updateMonthlyTheme
⑤レイアウト調整(横幅を画面に合わせる)
⑥画面表示
結果
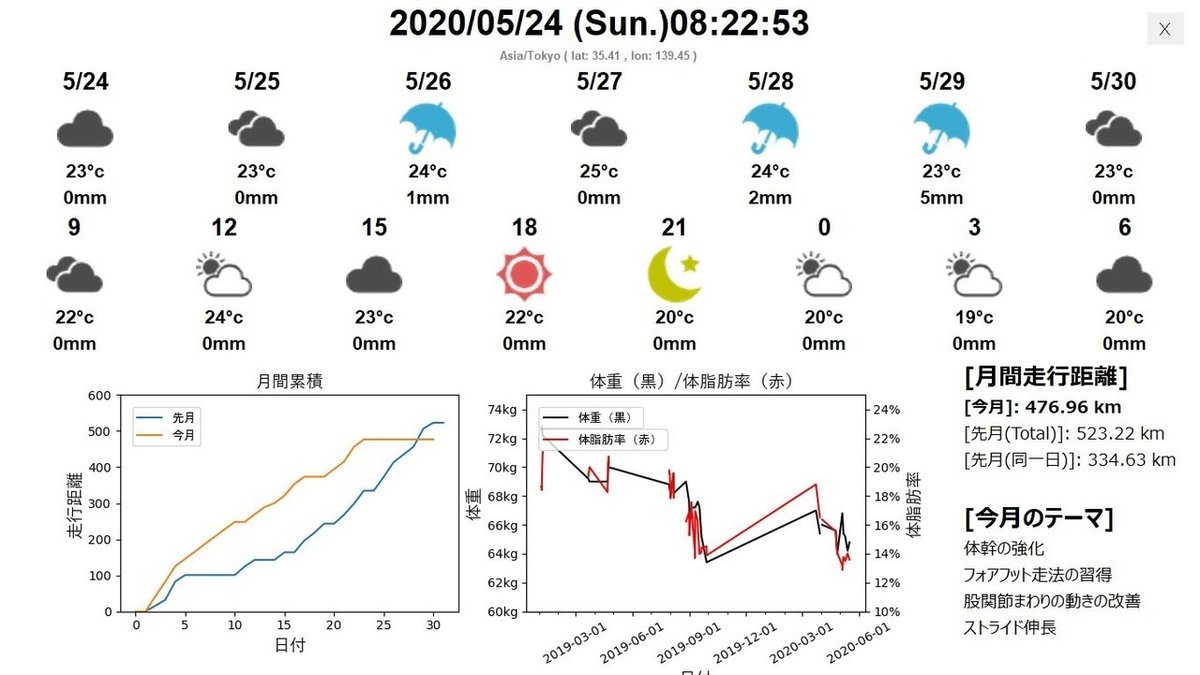
まだ改善の余地はあるものの、実用に耐えうるレベルになってきました。
いったんこの連載は終了ですが、次はe-Paperへの移植のタイミングで続編としてご紹介したいと思います。
ソースコード
Strava_RefreshToken.py
import requests
data = {
 'client_id': '12345',  ##クライアントID
 'client_secret': 'abcdefghijk12345.....',  ##クライアントシート
 'grant_type': 'refresh_token',
 'refresh_token': 'abcdefghijk12345.....'  ##リフレッシュトークン
}
r = requests.post('https://www.strava.com/api/v3/oauth/token', data=data)
rtext = r.json()
atoken = rtext["access_token"]
path_w = 'Strava_AccessToken.txt'
with open(path_w, mode='w') as f:
   f.write(atoken)
with open(path_w) as f:
   print(f.read())
Withings_RefreshToken.py
import requests

## ファイルをオープンする
refresh_token_file = 'Withings_RefreshToken.txt'
with open(refresh_token_file, 'r') as fd:
   WITHING_REFRESH_TOKEN = fd.readline().rstrip('\n')

data = {
 'client_id': '12345',  ##クライアントID
 'client_secret': 'abcdefghijk12345.....',  ##コンシューマーシークレット
 'grant_type': 'refresh_token',
 'refresh_token': WITHING_REFRESH_TOKEN
}
r = requests.post('https://account.withings.com/oauth2/token', data=data)
rtext = r.json()
atoken = rtext["access_token"]
rtoken = rtext["refresh_token"]
path_w = 'Withings_AccessToken.txt'
with open(path_w, mode='w') as f:
   f.write(atoken)
with open(path_w) as f:
   print(f.read())
path_w2 = 'Withings_RefreshToken.txt'
with open(path_w2, mode='w') as f:
   f.write(rtoken)
with open(path_w2) as f:
   print(f.read())
メインモジュール OpenWeather_Strava_Withings.py
注意:PythonのバージョンはV3.7.7以下でないと稼働しないようです。
(最新バージョンではStravaIOが導入できませんでした)
################################
####    共通設定/パラメーター   ####
################################

## 各種パッケージのインポート
from tkinter import *
import os
import requests
import json
import math
from PIL import Image, ImageTk
import datetime
from dateutil.relativedelta import relativedelta

from stravaio import StravaIO
import pandas as pd
import numpy as np
import matplotlib.pyplot as plt
from matplotlib.font_manager import FontProperties
from matplotlib.backends.backend_tkagg import FigureCanvasTkAgg
import matplotlib.ticker as ticker
import matplotlib.dates as mdates
from matplotlib.dates import DateFormatter

## OpenWeatherMapへのWeb APIアクセスURL設定

## パラメーター
TZ = "Asia/Tokyo"
LAT = "35.41"
LON = "139.45"
ZIP = "135-0023,JP"
KEY = "abcdefg12345....." ##OpenWeatherMap APIキー

## One Call API
openWeatherDailyUrl = "https://api.openweathermap.org/data/2.5/onecall"
openWeatherDailyUrlParams = {"lat": LAT,"lon": LON, "units":"metric","APPID": KEY}

## 5day/3hour Forecast API
openWeather3HourUrl = "http://api.openweathermap.org/data/2.5/forecast"
openWeather3HourUrlParams = {"zip": ZIP,"units":"metric","lang":"ja","APPID": KEY}

## このスクリプトの絶対パス
scr_path = os.path.dirname(os.path.abspath(sys.argv[0]))

## 天候アイコン(ディクショナリ)	openWeatherIconDict
openWeatherIconDict={
   "01d":Image.open(scr_path + "/img/01d.png"), "01n":Image.open(scr_path + "/img/01n.png"),
   "02d":Image.open(scr_path + "/img/02d.png"), "02n":Image.open(scr_path + "/img/02n.png"),
   "03d":Image.open(scr_path + "/img/03.png"),  "03n":Image.open(scr_path + "/img/03.png"),
   "04d":Image.open(scr_path + "/img/04.png"),  "04n":Image.open(scr_path + "/img/04.png"),
   "09d":Image.open(scr_path + "/img/09.png"),  "09n":Image.open(scr_path + "/img/09.png"),
   "10d":Image.open(scr_path + "/img/10.png"),  "10n":Image.open(scr_path + "/img/10.png"),
   "11d":Image.open(scr_path + "/img/11.png"),  "11n":Image.open(scr_path + "/img/11.png"),
   "13d":Image.open(scr_path + "/img/13.png"),  "13n":Image.open(scr_path + "/img/13.png"),
   "50d":Image.open(scr_path + "/img/50.png"),  "50n":Image.open(scr_path + "/img/50.png")
   }

## Stravaのアクセストークンファイル
stravaAccessTokenFile = 'Strava_AccessToken.txt'

## WithingsへのWeb APIアクセス時のパラメーター(設定値)
withingsMeasureUrl = "https://wbsapi.withings.net/measure"
withingsMeasureUrlParams = {"action":"getmeas"}
withingsMeasureUrlData ={
     'meastype': '1,6',        ##体重は1(Weight (kg))、体脂肪率は6(Fat Ratio (%))を指定
     'category': '1',            ##
     'startdate': '1546300800',  ##2019/1/1
     'enddate': '1735657200',    ##2025/1/1
     }
## Withingsのアクセストークンファイル
withingsAccessTokenFile = 'Withings_AccessToken.txt'


################################
###     OpenWeatherMap     #####
################################

########################    日付/地域表示フレーム(frame2)    ########################

def createTimeFrame():
## 日付・時刻			    openWeatherDt
## 地域					openWeatherPlace

   ## 日付・時刻表示(frame2の1行目に表示)
   global openWeatherDt
   openWeatherDt=Label(frame1, text="", bg="white", font=("", 30, "bold"))
   openWeatherDt.grid(in_=frame2,row=0, column=0, sticky="news")

   ## 地域表示(frame2の2行目に表示)
   global openWeatherPlace
   openWeatherPlace=Label(frame1, text="", bg="white", fg="gray", font=("", 10, "bold"))
   openWeatherPlace.grid(in_=frame2,row=1, column=0, sticky="news")

   return

########################    日時データ取得/更新    ########################

def updateTime():
## 日付・時刻						    openWeatherDt
## 地域								openWeatherPlace
## 表示日付(例:2020/5/21 (Thr.))	displayDate
## 表示時刻(例:15:35:56)			    displayTime

   ## 現在日時を表示
   now=datetime.datetime.now()
   displayDate="{0:0>4d}/{1:0>2d}/{2:0>2d} ({3}.)".format(now.year, now.month, now.day, now.strftime("%a"))
   displayTime="{0:0>2d}:{1:0>2d}:{2:0>2d}".format(now.hour, now.minute, now.second)
   openWeatherDt.configure(text=displayDate+displayTime)

   ## 地域情報を表示
   openWeatherPlace.configure(text=TZ + " ( lat: " + LAT + " , lon: " + LON + " ) ")

   ## 1秒間隔でUpdate
   frame1.after(1000, updateTime)

   return

########################    天気予報(日次)表示フレーム(frame3)    ########################

def createOpenWeatherDailyFrame():
## 天気予報(日付):日次			openWeatherDailyDate
## 天気予報(天候):日次			openWeatherDailyForecast
## 天気予報(気温):日次			openWeatherDailyTemp
## 天気予報(降水量):日次			openWeatherDailyRain


   ## 天気予報(日付)を配置(frame3の1行目に表示)
   global openWeatherDailyDate
   openWeatherDailyDate=[
       Label(frame1, text="X", bg="white", font=("", 20, "bold")),
       Label(frame1, text="X", bg="white", font=("", 20, "bold")),
       Label(frame1, text="X", bg="white", font=("", 20, "bold")),
       Label(frame1, text="X", bg="white", font=("", 20, "bold")),
       Label(frame1, text="X", bg="white", font=("", 20, "bold")),
       Label(frame1, text="X", bg="white", font=("", 20, "bold")),
       Label(frame1, text="X", bg="white", font=("", 20, "bold"))
   ]
   for i in range(len(openWeatherDailyDate)):
       openWeatherDailyDate[i].grid(in_=frame3,row=0, column=i, sticky="new")

   ## 天気予報(天候)を配置(frame3の2行目に表示)
   global openWeatherDailyForecast
   openWeatherDailyForecast=[
       Label(frame1, image=openWeatherIconDict["01d"], bg="white"),
       Label(frame1, image=openWeatherIconDict["01d"], bg="white"),
       Label(frame1, image=openWeatherIconDict["01d"], bg="white"),
       Label(frame1, image=openWeatherIconDict["01d"], bg="white"),
       Label(frame1, image=openWeatherIconDict["01d"], bg="white"),
       Label(frame1, image=openWeatherIconDict["01d"], bg="white"),
       Label(frame1, image=openWeatherIconDict["01d"], bg="white")
   ]
   for i in range(len(openWeatherDailyForecast)):
       openWeatherDailyForecast[i].grid(in_=frame3,row=1, column=i, sticky="new")

   ## 天気予報(気温)を配置(frame3の3行目に表示)
   global openWeatherDailyTemp
   openWeatherDailyTemp=[
       Label(frame1, text="X°C", bg="white", font=("", 16, "bold")),
       Label(frame1, text="X°C", bg="white", font=("", 16, "bold")),
       Label(frame1, text="X°C", bg="white", font=("", 16, "bold")),
       Label(frame1, text="X°C", bg="white", font=("", 16, "bold")),
       Label(frame1, text="X°C", bg="white", font=("", 16, "bold")),
       Label(frame1, text="X°C", bg="white", font=("", 16, "bold")),
       Label(frame1, text="X°C", bg="white", font=("", 16, "bold"))
   ]
   for i in range(len(openWeatherDailyTemp)):
       openWeatherDailyTemp[i].grid(in_=frame3,row=2, column=i, sticky="new")

   ## 天気予報(降水量)(frame3の4行目に表示)
   global openWeatherDailyRain
   openWeatherDailyRain=[
       Label(frame1, text="Xmm", bg="white", font=("", 16, "bold")),
       Label(frame1, text="Xmm", bg="white", font=("", 16, "bold")),
       Label(frame1, text="Xmm", bg="white", font=("", 16, "bold")),
       Label(frame1, text="Xmm", bg="white", font=("", 16, "bold")),
       Label(frame1, text="Xmm", bg="white", font=("", 16, "bold")),
       Label(frame1, text="Xmm", bg="white", font=("", 16, "bold")),
       Label(frame1, text="Xmm", bg="white", font=("", 16, "bold"))
   ]
   for i in range(len(openWeatherDailyRain)):
       openWeatherDailyRain[i].grid(in_=frame3,row=3, column=i, sticky="new")

   return


########################    天気予報(日次)データ取得/更新    ########################

def updateDailyWeather():
## One Call API(日次)URL		    openWeatherDailyUrl
## One Call APIパラメーター			openWeatherDailyUrlParams
## One Call API取得データ				forecastDailyData
## One Call API取得データ処理カウンタ	countDailyData

   ## 表示カウンタ
   countDailyData=0

   ## OpenWeatherMap に問い合わせを行う
   response=requests.get(openWeatherDailyUrl,params=openWeatherDailyUrlParams)
   forecastDailyData=json.loads(response.text)

   ## 結果が得られない場合は即時終了
   if not ("daily" in forecastDailyData):
       print("error")
       return

   ## 結果を 1日単位で取得
   for item in forecastDailyData["daily"]:
       ## 日付を表示(mm/dd)
       openWeatherDailyDate[countDailyData].configure(text=str(datetime.datetime.fromtimestamp(item["dt"]).month) + "/" + str(datetime.datetime.fromtimestamp(item["dt"]).day))

       ## 気候をアイコンで表示
       openWeatherDailyForecast[countDailyData].configure(image=openWeatherIconDict[item["weather"][0]["icon"]])

       ## 気温を表示
       openWeatherDailyTemp[countDailyData].configure(text="{0}°c".format(round(item["temp"]["day"])))

       ## 降水量を表示
       rainfall = 0
       if "rain" in item:
           rainfall = item["rain"]
       openWeatherDailyRain[countDailyData].configure(text="{0}mm".format(math.ceil(rainfall)))

       ## 表示カウンタを更新
       countDailyData += 1

       ## 全て表示し終えたらループ終了
       if countDailyData >= len(openWeatherDailyDate):

           ## 60 秒間隔で繰り返す
           frame1.after(60000, updateDailyWeather)

           return


########################    天気予報(3時間毎)表示フレーム(frame4)    ########################

def createOpenWeather3HourFrame():
## 天気予報(時間帯):3時間毎		openWeather3HourHour
## 天気予報(天候):3時間毎		    openWeather3HourForecast
## 天気予報(気温):3時間毎		    openWeather3HourTemp
## 天気予報(降水量):3時間毎		openWeather3HourRain

   ## 天気予報(時間)を配置(frame4の1行目に表示)
   global openWeather3HourHour
   openWeather3HourHour=[
      Label(frame1, text="X", bg="white", font=("", 20, "bold")),
      Label(frame1, text="X", bg="white", font=("", 20, "bold")),
      Label(frame1, text="X", bg="white", font=("", 20, "bold")),
      Label(frame1, text="X", bg="white", font=("", 20, "bold")),
      Label(frame1, text="X", bg="white", font=("", 20, "bold")),
      Label(frame1, text="X", bg="white", font=("", 20, "bold")),
      Label(frame1, text="X", bg="white", font=("", 20, "bold")),
      Label(frame1, text="X", bg="white", font=("", 20, "bold"))
   ]
   for i in range(len(openWeather3HourHour)):
       openWeather3HourHour[i].grid(in_=frame4,row=0, column=i, sticky="news")

   ## 天気予報(天候)を配置(frame4の2行目に表示)
   global openWeather3HourForecast
   openWeather3HourForecast=[
       Label(frame1, image=openWeatherIconDict["01d"], bg="white"),
       Label(frame1, image=openWeatherIconDict["01d"], bg="white"),
       Label(frame1, image=openWeatherIconDict["01d"], bg="white"),
       Label(frame1, image=openWeatherIconDict["01d"], bg="white"),
       Label(frame1, image=openWeatherIconDict["01d"], bg="white"),
       Label(frame1, image=openWeatherIconDict["01d"], bg="white"),
       Label(frame1, image=openWeatherIconDict["01d"], bg="white"),
       Label(frame1, image=openWeatherIconDict["01d"], bg="white")
   ]
   for i in range(len(openWeather3HourForecast)):
       openWeather3HourForecast[i].grid(in_=frame4,row=1, column=i, sticky="news")

   ## 天気予報(気温)を配置(frame4の3行目に表示)
   global openWeather3HourTemp
   openWeather3HourTemp=[
       Label(frame1, text="X°C", bg="white", font=("", 16, "bold")),
       Label(frame1, text="X°C", bg="white", font=("", 16, "bold")),
       Label(frame1, text="X°C", bg="white", font=("", 16, "bold")),
       Label(frame1, text="X°C", bg="white", font=("", 16, "bold")),
       Label(frame1, text="X°C", bg="white", font=("", 16, "bold")),
       Label(frame1, text="X°C", bg="white", font=("", 16, "bold")),
       Label(frame1, text="X°C", bg="white", font=("", 16, "bold")),
       Label(frame1, text="X°C", bg="white", font=("", 16, "bold"))
   ]
   for i in range(len(openWeather3HourTemp)):
       openWeather3HourTemp[i].grid(in_=frame4,row=2, column=i, sticky="news")

   ## 天気予報(降水量)を配置(frame4の4行目に表示)
   global openWeather3HourRain
   openWeather3HourRain=[
       Label(frame1, text="Xmm", bg="white", font=("", 16, "bold")),
       Label(frame1, text="Xmm", bg="white", font=("", 16, "bold")),
       Label(frame1, text="Xmm", bg="white", font=("", 16, "bold")),
       Label(frame1, text="Xmm", bg="white", font=("", 16, "bold")),
       Label(frame1, text="Xmm", bg="white", font=("", 16, "bold")),
       Label(frame1, text="Xmm", bg="white", font=("", 16, "bold")),
       Label(frame1, text="Xmm", bg="white", font=("", 16, "bold")),
       Label(frame1, text="Xmm", bg="white", font=("", 16, "bold"))
   ]
   for i in range(len(openWeather3HourRain)):
       openWeather3HourRain[i].grid(in_=frame4,row=3, column=i, sticky="news")

   return

########################    天気予報(3時間毎)データ取得/更新    ########################

def update3hourWeather():
## Forecast API(3時間毎)URL		    openWeather3HourUrl
## Forecast API パラメーター		    openWeather3HourUrlparams
## Forecast API取得データ			    forecast3HourData
## Forecast API取得データ処理カウンタ	count3HourData

   ## OpenWeatherMap に問い合わせを行う
   response=requests.get(openWeather3HourUrl,params=openWeather3HourUrlParams)
   forecast3HourData=json.loads(response.text)

   ## 結果が得られない場合は即時終了
   if not ("list" in forecast3HourData):
       print("error")
       return

   ## 表示カウンタ
   count3HourData=0

   ## 結果を 3 時間単位で取得
   for item in forecast3HourData["list"]:
       ## 時間帯を 24 時間表記で表示
       openWeather3HourHour[count3HourData].configure(text=datetime.datetime.fromtimestamp(item["dt"]).hour)

       ## 気候をアイコンで表示
       openWeather3HourForecast[count3HourData].configure(image=openWeatherIconDict[item["weather"][0]["icon"]])

       ## 気温を表示
       openWeather3HourTemp[count3HourData].configure(text="{0}°c".format(round(item["main"]["temp"])))

       ## 降水量を表示
       rainfall = 0
       if "rain" in item and "3h" in item["rain"]:
       	rainfall = item["rain"]["3h"]
       openWeather3HourRain[count3HourData].configure(text="{0}mm".format(math.ceil(rainfall)))

       ## 表示カウンタを更新
       count3HourData += 1

       ## 全て表示し終えたらループ終了
       if count3HourData >= len(openWeather3HourHour):

           ## 60 秒間隔で繰り返す
           frame1.after(60000, update3hourWeather)

           return


################################
###         Strava         #####
################################
def updateStrava():
   ##### timestampから月初とその1か月前を取得
   dt_now = datetime.datetime.now() ## 現時点の日時を取得 (yyyy-mm-dd hh:mm:ss.mmmmmm)
   stravaFirstDayofThisMonth = dt_now.replace(day=1,hour=0,minute=0,second=0,microsecond=0) ## 月初に置き換え
   stravaFirstDayofThisMonthTimestamp= stravaFirstDayofThisMonth.timestamp()  ## timestampに変換

   ## 今日:today_d
   today_d = dt_now.astimezone(datetime.timezone(datetime.timedelta(hours=+9))).day

   ## 今月:today_m
   today_m =stravaFirstDayofThisMonth.month

   stravaFirstDayofPrevMonth = stravaFirstDayofThisMonth + relativedelta(months=-1)
   stravaFirstDayofPrevMonthTimestamp = stravaFirstDayofPrevMonth.timestamp()  ## timestampに変換

   ## StravaのAccessTokenをRefreshする。(ファイルに保管)
   import Strava_RefreshToken

   ## StravaのAccessTokenをファイルから取得する。
   with open(stravaAccessTokenFile, 'r') as fd:
       STRAVA_ACCESS_TOKEN = fd.readline().rstrip('\n')

   ## StravaIOを実行。
   client = StravaIO(access_token=STRAVA_ACCESS_TOKEN)
   client.__dict__

   ## athleteデータを取得
   athlete = client.get_logged_in_athlete()

   ## activitiesデータを取得
   activities = client.get_logged_in_athlete_activities(after=int(stravaFirstDayofPrevMonthTimestamp))

   ## Listを初期化(Listx:日付、Listy:前月走行距離、Listz:今月走行距離)
   listx = [1,2,3,4,5,6,7,8,9,10,11,12,13,14,15,16,17,18,19,20,21,22,23,24,25,26,27,28,29,30,31]
   listy = np.array([0]*31, dtype = 'float')
   listz = np.array([0]*31, dtype = 'float')

   ## listyに先月の1日~31日の1日単位の走行距離、listzに今月の1日~今日の1日単位の走行距離を格納。
   to_plot = []
   for a in activities:
       stravaActivityMonth = a.start_date.astimezone(datetime.timezone(datetime.timedelta(hours=+9))).month
       stravaActivityDay = a.start_date.astimezone(datetime.timezone(datetime.timedelta(hours=+9))).day


       if stravaActivityMonth == today_m:  ## Activityが今月ならlistz(今月)の該当日に距離を加算
              listz[stravaActivityDay-1] = listz[stravaActivityDay-1] + a.distance/1000
       else:  ## Activityが先月ならlisty(先月)の該当日に距離を加算
              listy[stravaActivityDay-1] = listy[stravaActivityDay-1] + a.distance/1000

       s = client.get_activity_streams(a.id, athlete.api_response.id)
       if isinstance(s, pd.DataFrame):
           _s = s
       else:
           s.store_locally()
           _s = s.to_dict()
       to_plot.append({
           'activity': a,
           'streams': s
       })

   ## 月間走行距離を累積和のグラフにするため、cumsum関数を使用
   listsumy=listy.cumsum()
   listsumz=listz.cumsum()

   ## 月間走行距離(直近の累積距離)
   global thisMonthDistance
   thisMonthDistance = listsumz[today_d-1]
   global prevMonthDistance
   prevMonthDistance = listsumy[30]
   global prevMonthDistance2
   prevMonthDistance2 = listsumy[today_d-1]

########################    Stravaグラフ作成    ########################

   ## 表示エリアの設定
   global fig
   fig = plt.Figure()
   ax1 = fig.add_subplot(121)
   ax1.plot(listx, listsumy, listsumz)

   fp = FontProperties(fname=r'C:\WINDOWS\Fonts\YuGothM.ttc', size=14)
   ax1.set_title(u'月間累積',fontproperties = fp)     ## タイトル名
   ax1.set_xlabel(u'日付',fontproperties = fp)       ## 横軸のラベル名
   ax1.set_ylabel(u'走行距離',fontproperties = fp)    ## 縦軸のラベル名
   ax1.set_ylim(0, 600)
   ax1.legend(['先月','今月'],bbox_to_anchor=(0, 1), loc='upper left', borderaxespad=1, fontsize=8,prop={"family":"MS Gothic"})

   return


################################
###        Withings        #####
################################
def updateWithings():
## withingsアクセストークンファイル			withingsAccessTokenFile
## Withings API(Measure) URL			withingsMeasureUrl
## Withings API(Measure) URLパラメーター	withingsMeasureUrlParams
## Withings API(Measure) URLヘッダー		withingsMeasureUrlHeaders
## Withings API(Measure) URLデータ		withingsMeasureUrlData
## Withings測定データ						withingsMeasureGrps
## Withings測定データ件数					withingsMeasureCount

   ## WithingsのAccessTokenをRefreshする。(ファイルに保管)
   import Withings_RefreshToken
   ## WithingsのAccessTokenをファイルから取得する。
   with open(withingsAccessTokenFile, 'r') as fd:
       WITHING_ACCESS_TOKEN = fd.readline().rstrip('\n')

   ## Withings に問い合わせを行う
   withingsMeasureUrlHeaders = {'Authorization': 'Bearer '+WITHING_ACCESS_TOKEN}
   response = requests.get(withingsMeasureUrl,params=withingsMeasureUrlParams,headers=withingsMeasureUrlHeaders,data=withingsMeasureUrlData)
   rtext = response.json()
   withingsMeasureGrps = rtext['body']['measuregrps']

   ## "body" -> "measuregrps"配下の測定データの個数をカウントして、その個数分の配列を作成
   withingsMeasureCount = len(withingsMeasureGrps)
   ## x軸:時間、y軸(1):体重、y軸(2):体脂肪率
   listx = [None]*withingsMeasureCount
   listy1 = [None]*withingsMeasureCount
   listy2 = [None]*withingsMeasureCount


   ##### 測定データから"date"の値を取得し、"maeasures"以下からtype:1(体重)、type:6(体脂肪率)を取得

   ## 測定データの個数分、以下を繰り返す
   for i in range(withingsMeasureCount):
       tmpMeasureGrp = withingsMeasureGrps[i]  ##tmpMeasureGrp:測定データ(1回分)
   ## "date"の値を取得して、timestampから日付形式に変換
       listx[i] = datetime.datetime.fromtimestamp(tmpMeasureGrp['date'])

   ## "maeasures"以下の各type毎のデータのうち、type:1(体重)、type:6(体脂肪率)のデータを取得
       for j in range(len(tmpMeasureGrp['measures'])):
           tmpMeasure = tmpMeasureGrp['measures'][j]    ##tmpMeasure:Type毎データ
           if tmpMeasure['type'] == 1:
               listy1[i] = tmpMeasure['value']/1000  ##Weight
           elif tmpMeasure['type'] == 6:
               listy2[i] = tmpMeasure['value']/1000  ##Fat Ratio


########################    Withingsグラフ作成    ########################

   ## 表示エリアの設定
   fig.subplots_adjust(bottom=0.2)
   ax1 = fig.add_subplot(122)

   ## 2軸グラフの設定(ax1とax2を関連させる)
   ax2 = ax1.twinx()

   ax1.plot(listx,listy1,color='black',label="体重")  ## 体重グラフ(1軸)を作成
   ax2.plot(listx,listy2,color='red',label="体脂肪率")  ## 体脂肪率グラフ(2軸)を作成

   fp = FontProperties(fname=r'C:\WINDOWS\Fonts\YuGothM.ttc', size=14)    ##フォントファイルを指定

   ## 体重グラフ(1軸)の表示設定
   ax1.set_title(u'体重(黒)/体脂肪率(赤)',fontproperties = fp)  ## タイトル名
   ax1.set_xlabel(u'日付',fontproperties = fp)     ## 横軸のラベル名
   ax1.set_ylabel(u'体重',fontproperties = fp)    ## 縦軸のラベル名
   ax1.legend(['体重(黒)'],bbox_to_anchor=(0, 1), loc='upper left', borderaxespad=1, fontsize=8, prop={"family":"MS Gothic"})    ## 凡例を設定
   ax1.set_ylim(60,75)    ## 縦軸の上限、下限を設定

   ## 体脂肪率グラフ(2軸)の表示設定
   ax2.set_xlabel(u'',fontproperties = fp)              ## 横軸のラベル名
   ax2.set_ylabel(u'体脂肪率',fontproperties = fp)          ## 縦軸のラベル名
   ax2.legend(['体脂肪率(赤)'],bbox_to_anchor=(0, 0.9), loc='upper left', borderaxespad=1, fontsize=8, prop={"family":"MS Gothic"})    ## 凡例を設定
   ax2.set_ylim(10,25)    ## 縦軸の上限、下限を設定

   ## 軸の目盛りに単位をつける
   ax1.yaxis.set_major_formatter(ticker.FormatStrFormatter("%dkg"))    ## 単位(kg)を付与
   ax2.yaxis.set_major_formatter(ticker.FormatStrFormatter("%d%%"))    ## 単位(%)を付与

   ## x軸(日付)の表示設定
   xaxis_ = ax1.xaxis
   xaxis_.set_major_formatter(DateFormatter('%Y-%m-%d'))    ## x軸(日付)の表記フォーマット
   xaxis_.set_major_locator(mdates.MonthLocator(interval=3))    ## x軸(日付)のラベル間隔
   xaxis_.set_minor_locator(mdates.MonthLocator(interval=1))    ## x軸(日付)の目盛間隔
   xlabels = ax1.get_xticklabels()
   plt.setp(xlabels, rotation=30)    ## x軸(日付)の表示が重ならなうように回転

   canvas = FigureCanvasTkAgg(fig, master=frame1)
   canvas.draw()
   canvas.get_tk_widget().pack(in_=frame5,fill = BOTH,expand=True,side=LEFT)

   return


################################
###     Monthly Theme      #####
################################

def updateMonthlyTheme():

   ## ラベル作成
   lbl1 = Label(frame1,text='[月間走行距離]    ',foreground='#000000', background='#ffffff', font=('Meiryo UI', '20', 'bold'))
   lbl2 = Label(frame1,text='[今月]: ' + '{:.2f}'.format(thisMonthDistance) +' km    ',foreground='#000000', background='#ffffff', font=('Meiryo UI', '14', 'bold'))
   lbl3 = Label(frame1,text='[先月(Total)]: ' + '{:.2f}'.format(prevMonthDistance) +' km    ',foreground='#000000', background='#ffffff', font=('Meiryo UI', '14'))
   lbl4 = Label(frame1,text='[先月(同一日)]: ' + '{:.2f}'.format(prevMonthDistance2) +' km    ',foreground='#000000', background='#ffffff', font=('Meiryo UI', '14'))
   lbl5 = Label(frame1,text='',foreground='#000000', background='#ffffff', font=('Meiryo UI', '14'))
   lbl6 = Label(text='[今月のテーマ]',foreground='#000000', background='#ffffff', font=('Meiryo UI', '20', 'bold'))
   lbl7 = Label(text='体幹の強化    ',foreground='#000000', background='#ffffff', font=('Meiryo UI', '14'))
   lbl8 = Label(text='フォアフット走法の習得    ',foreground='#000000', background='#ffffff', font=('Meiryo UI', '14'))
   lbl9 = Label(text='股関節まわりの動きの改善    ',foreground='#000000', background='#ffffff', font=('Meiryo UI', '14'))
   lbl10 = Label(text='ストライド伸長    ',foreground='#000000', background='#ffffff', font=('Meiryo UI', '14'))


   lbl1.pack(in_=frame5,side=TOP,anchor=W)
   lbl2.pack(in_=frame5,side=TOP,anchor=W)
   lbl3.pack(in_=frame5,side=TOP,anchor=W)
   lbl4.pack(in_=frame5,side=TOP,anchor=W)
   lbl5.pack(in_=frame5,side=TOP,anchor=W)
   lbl6.pack(in_=frame5,side=TOP,anchor=W)
   lbl7.pack(in_=frame5,side=TOP,anchor=W)
   lbl8.pack(in_=frame5,side=TOP,anchor=W)
   lbl9.pack(in_=frame5,side=TOP,anchor=W)
   lbl10.pack(in_=frame5,side=TOP,anchor=W)

   return

##################################    メイン処理    ##################################

## メインウィンドウ作成
frame1 = Tk()

## アイコンサイズを画面サイズにフィット(64x64)させる
for key, value in openWeatherIconDict.items():
   openWeatherIconDict[key]=openWeatherIconDict[key].resize((64, 64), Image.ANTIALIAS)
   openWeatherIconDict[key]=ImageTk.PhotoImage(openWeatherIconDict[key])

## メインウィンドウサイズ
frame1.geometry("1024x768")

## フレームを作成
frame2=Frame(frame1, bg="white")    ##日付/地域 表示フレーム
frame3=Frame(frame1, bg="white")    ##天気予報(日次) 表示フレーム
frame4=Frame(frame1, bg="white")    ##天気予報(3時間毎) 表示フレーム
frame5=Frame(frame1, bg="white")    ##Stravaグラフ/Withingsグラフ/今月のテーマ 表示フレーム

## 各フレームの内部を作成
createTimeFrame()
updateTime()
createOpenWeatherDailyFrame()
updateDailyWeather()
createOpenWeather3HourFrame()
update3hourWeather()
updateStrava()
updateWithings()
updateMonthlyTheme()

## ジオメトリマネージャーで各項目を表示
frame2.pack(fill= BOTH,expand=True)
frame3.pack(fill= BOTH,expand=True)
frame4.pack(fill= BOTH,expand=True)
frame5.pack(fill= BOTH,expand=True)

## レイアウト調整(横幅を画面に合わせる)
frame2.columnconfigure(0, weight=1)  ##frame1は1項目なので引数は0

for i in range(len(openWeatherDailyDate)):   ##frame2は7項目なので0~6を順番に実行
   frame3.columnconfigure(i, weight=1)

for i in range(len(openWeather3HourHour)):   ##frame3は8項目なので0~7を順番に実行
   frame4.columnconfigure(i, weight=1)

frame5.columnconfigure(0, weight=1)  ##frame1は1項目なので引数は0

## メインウィンドウを閉じる
def wm_close():
   frame1.destroy()

## Closeボタン(X)
btn=Button(frame1, text=" X ", font=('', 16), relief=FLAT, command=wm_close)

## 画面がリサイズされたとき
def change_size(event):
   # ボタンの位置を右上に
   btn.place(x=frame1.winfo_width() - 60, y=14)

## 画面のリサイズをバインドする
frame1.bind('<Configure>', change_size)

## メインウィンドウの最大化、最前面表示
frame1.attributes("-fullscreen", "1")
frame1.attributes("-topmost", True)

## コールバック関数を登録
frame1.after(1000,  updateTime)
frame1.after(60000, updateDailyWeather)
frame1.after(60000, update3hourWeather)

## メインループ
frame1.mainloop()
(おわり)
よろしければサポートお願いします。