
#11 AIと水(3)

今回は衛星画像を利用した企業2社の紹介を実施したいと思います。
(以下常体)
1.Gybe社
Q1.Gybeは一言で言うとどのような会社か?
Gybeは、衛星画像とセンサーを使用して水質パラメーターを監視し、機械学習を使用して藻類の発生を予測し、飲料水の品質向上に貢献している。
Q2.Gybeの解決したいのはどのような社会課題か?
気候変動、過剰な栄養分の流出などさまざまな変化が都市の水源の不確実性を下げている。モニタリングに必要な範囲は拡大し続けており、より多様な種類の情報が求められている。
Q3.Gybeが社会課題に対して提供するものは何か?
貯水池のこれまで監視されていなかった部分で発生した問題をより早く発見し、変化を発見したときの対症療法的な管理から、より予防的な計画へと移行することを可能にし、水質および運用管理者の負担を軽減している。
Q4.Gybeはどのようにデータソースとなる衛星画像を取得しているか?
欧州宇宙機関のSentinel 2 A & Bプラットフォームから取得され、5日ごとに地球上の同じ場所で高解像度(10-20 m)のマルチスペクトル(490-865 nm)画像を作成することができる。これらの画像データは一般向けに無償配布され、衛星データ処理手法の出発点として使用されている。この処理方法は、生の大気圏上層部の画像を取り込み、大気の影響を補正し、一連のWQメトリクスを計算し、さまざまな表示および分析プラットフォームで使用できるようにデータリポジトリを作成する。この研究では、3つの異なるWQメトリクスが計算され、各水域の評価に使用されている。
Q5.具体的にどの指標が画像から抽出されているか?
浮遊物質濃度SSや濁度NTU、クロロフィル濃度が測定できる。
Q6.分析やレポートはどう意志決定に用いられているか?
貯水池の水位が高くなる時にクロロフィル濃度が高くなることが明確になる。
また、気象・水文データセットにより、水量と水質の関係についてさらに詳しい情報を得ることができます。さらに、廃水インフラの品質、廃棄物の流出場所、ロックダウン中の人口移動の変化に関する地理空間情報を利用して、都市システム内のさらに上流で大きな混合が起こる前に調査すべき場所を特定することができる。
Q7.どのような効果があったか?
効果(ケーススタディ)
コストを7%増やすだけで情報密度を10倍にすることができた。
観測から通知までの時間は、2~3日(水サンプル+ラボ検査の場合)から1時間に短縮された。
Q7.どのような示唆を得たか?
衛星データはオープンソースであることは新しい発見。画像解析系のものを作るにはオープンソースに何があるかを知っておくことが重要と考えた。
モニタリングによって得られた示唆を何のアクションの意思決定に使うのかという雲雨傘の傘の部分の説明があまりない+傘の部分がきちんとわかっていないと市場規模の計算等ができないということがわかったので、その部分の具体的なアクションについてきちんと調べたい。
2.天地人
Q1.一言で言うとどのような会社か?
天地人はJAXA発で、衛星から撮影した画像やデータを収集、解析することでビジネスの意思決定をサポートするテック×コンサルティングのスタートアップである。
Q2.天地人の取り組んでいる課題は?
衛星画像からの環境要因(地表面温度・光学画像・気象データ・植生変化)と水道事業体が保有する水道管路のデータを組み合わせて、漏水可能性区域の判定を行なっている。
Q3. 課題に対して何を提供しているか?
漏水リスク評価によって選定された高リスク区域を高い発見率で特定できる。さらに、従来の衛星データを利用した漏水検知技術では対応できなかった、水道管の亀裂による小さな漏水やコンクリートの路面下、山間部、湧水周辺等の複合的な環境での漏水調査にも、本システムは寄与できる。そのため、漏水の速やかな削減や、水道管路を効率的に管理ができる。
Q4.実際の具体例にはどのようなものがあるか?
具体例として天地人が豊田市と実施した実験では、衛星画像からの環境要因(地表面温度・光学画像・気象データ・植生変化)と水道事業体が保有する水道管路のデータを組み合わせて、漏水可能性区域の判定を行なっている。
豊田市全域で249の漏水可能性区域を判定した結果として
・249の漏水可能性区域内で実際に漏水調査(路面音聴調査)を実施したところ、その内65区域77か所で漏水を確認(的中率は約3割)。
・過去に豊田市で行われた実証実験と比較して、1区域あたりの判定可能範囲が、直径200mの円範囲から約100m四方に狭まり、漏水調査対象範囲が約3分の1に縮小されたことで、より一層調査効率が向上した。
Q5.実際にツールを使ってどのように判定を実施しているのか?
<分析>
通常の地図でできないのは
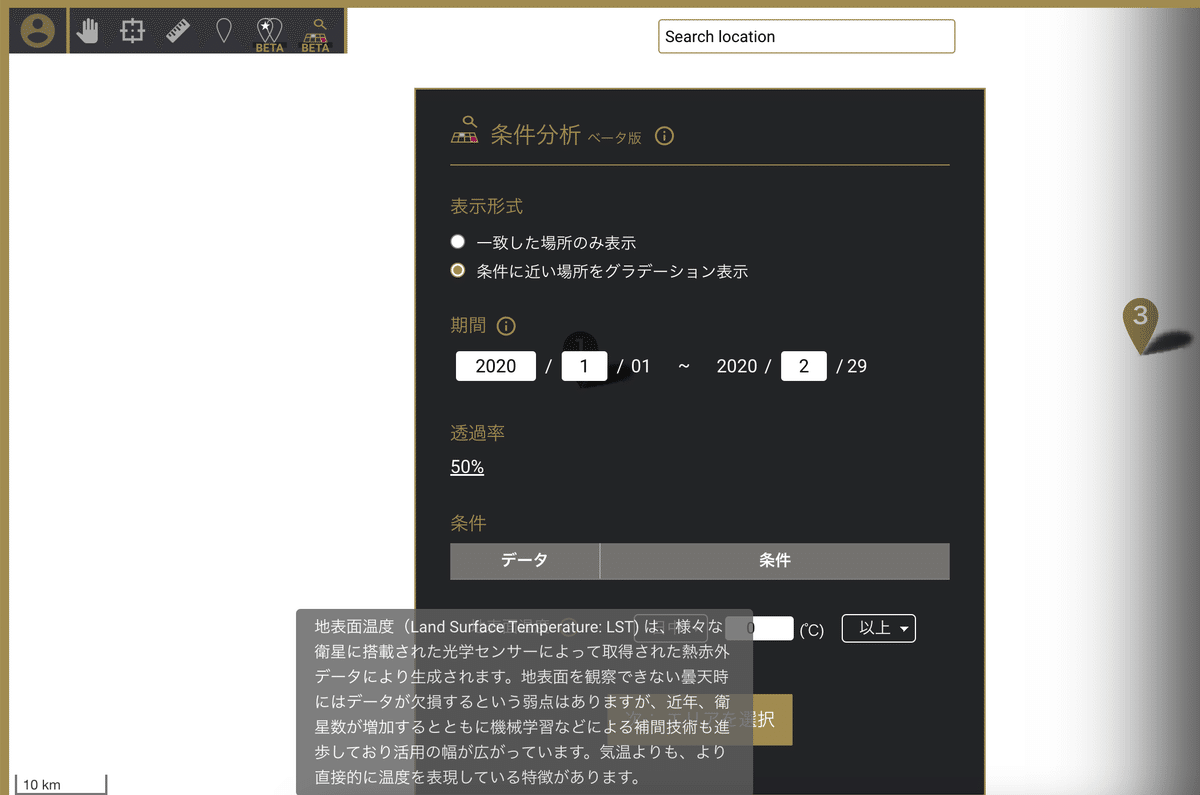
・条件分析
例 指定して範囲内から地表面の温度が15度以上のところの検索
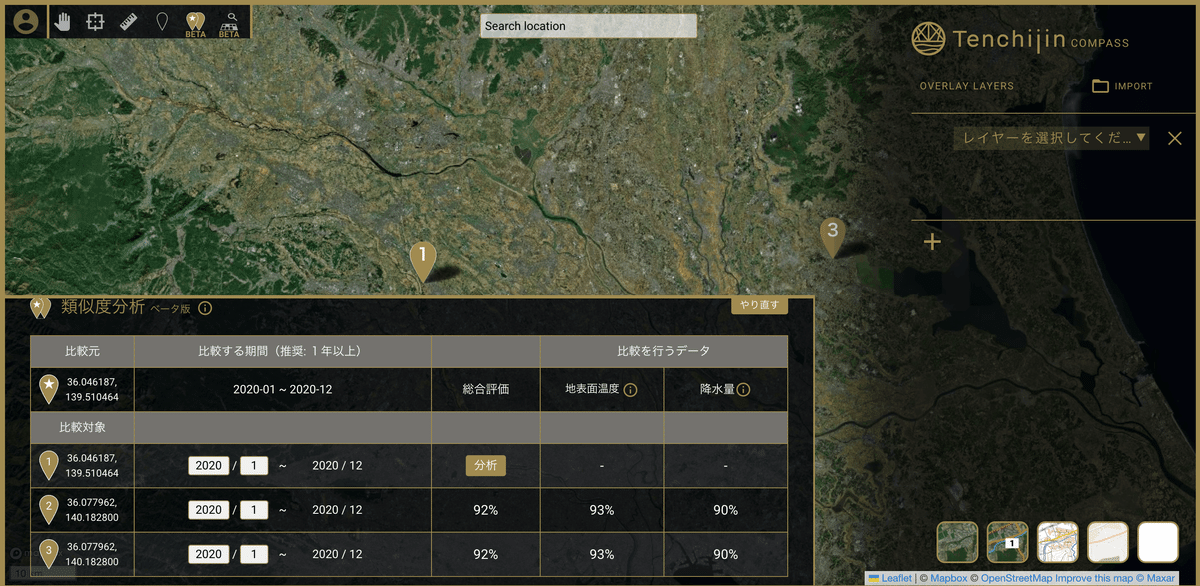
・地点の類似度(降水量・気温の検索)計算
例 埼玉県戸田市(私の部活の寮があります)の降水の傾向等と似ている部分を確率で計算
の二つである。
<地図>
国土地理院の発行している地図表示させることができる。
例 土地利用図など
<レイヤー>
地質図・土地利用図・植生図・洪水時浸水図などが地図上で色分けされます。
Q6.どのような示唆を得たか?
既存の課題+新しいデータと既存のデータを組み合わせるというソフトウェアコンサル系のスタートアップのパターンのようなものが掴めてきた。
ネクストアクションについては、既存の水道事業の課題において定性的には課題として把握されているが、数字としての落とし込みができていないデータ×新しく入手できるデータにどのようなものがあるかということか。個人的には家庭からの通報のFAQの定量化による処理時間削減とか面白そうだなと思っている。
直感的な操作が可能で、非常に操作しやすい。(操作方法わからなくても使えた)→ユーザーテストの重要性を実感した
必要なデータ設計と得たい考察の仮説を立てることが重要である。
雨(示唆)と傘(ネクストアクション)の部分を得るためにどの雲(データ)を見つければいいか、組み合わせればいいかということである。
→この場合洪水図・土地利用図・降水量を重ね合わせ降水が少ないが以外と危険な場所を知るなどの例がある。
以上、お読みいただきありがとうございました。
English below
I would like to introduce two companies that use satellite imagery
Gybe, Inc.
Q1. What is Gybe in a nutshell?
Gybe uses satellite imagery and sensors to monitor water quality parameters and uses machine learning to predict algae blooms, helping to improve the quality of drinking water.
Q2. What social issues does Gybe want to solve?
Climate change, excess nutrient runoff, and various other changes are reducing the uncertainty of urban water sources. The scope of monitoring needs continues to expand and more diverse types of information are required.
Q3. What does Gybe offer to social issues?
Gybe is reducing the burden on water quality and operational managers by allowing them to detect problems in previously unmonitored parts of the reservoir earlier and to move from symptomatic management when changes are detected to more preventative planning.
Q4. How does Gybe acquire satellite imagery as a data source?
Acquired from the European Space Agency's Sentinel 2 A & B platforms, Gybe is able to produce high-resolution (10-20 m) multispectral (490-865 nm) images of the same location on Earth every 5 days. These image data are distributed free of charge to the public and are used as a starting point for satellite data processing methods. This processing method takes raw upper atmosphere imagery, corrects for atmospheric effects, calculates a set of WQ metrics, and creates a data repository for use in a variety of viewing and analysis platforms. In this study, three different WQ metrics were calculated and used to evaluate each water body.
Q5. Which specific metrics are extracted from the images?
Suspended sediment concentration SS, turbidity NTU, and chlorophyll concentration can be measured.
Q6. How are the analyses and reports used for decision-making?
It is clear that chlorophyll concentration increases when the water level in the reservoir is high. In addition, meteorological and hydrological data sets provide further information on the relationship between water quantity and water quality. In addition, geospatial information on the quality of wastewater infrastructure, the location of waste spills, and changes in population movements during lockdown can be used to identify areas to investigate before major mixing occurs further upstream in the urban system.
Q7.What was the effect of the project?
Effectiveness (Case Study) We were able to increase information density by a factor of 10 with only a 7% increase in cost. Time from observation to notification was reduced from 2~3 days (for water sample + lab test) to 1 hour.
Q7. What suggestions did you get?
Satellite data is open source, which is a new discovery. We thought it was important to know what is in open source to create an image analysis system. There is not much explanation of the umbrella part of the cloud/rain umbrella, which is to use the suggestions obtained from monitoring to make decisions on what actions to take. + I found out that it is impossible to calculate the market size, etc. without a proper understanding of the umbrella part, so I would like to properly investigate specific actions for that part.
Tenchi-jin
Q1. In a word, what kind of company is it?
Tenchijin is a tech x consulting startup from JAXA that supports business decision making by collecting and analyzing images and data taken from satellites.
Q2. What are the issues that Tenchito is working on?
We are combining environmental factors (ground surface temperature, optical images, weather data, vegetation changes) from satellite images with data on water pipelines owned by water utilities to determine potential leakage zones.
Q3. What are you providing for the issue?
High-risk areas selected by leakage risk assessment can be identified with a high detection rate. Furthermore, this system can contribute to leakage surveys in complex environments where conventional leak detection technologies using satellite data cannot, such as small leaks due to cracks in water pipes, under concrete road surfaces, in mountainous areas, and around springs. Thus, leaks can be reduced quickly and water pipelines can be managed efficiently.
Q4. What are some actual concrete examples?
As a concrete example, in an experiment conducted by TENJITO with Toyota City, environmental factors (ground surface temperature, optical images, weather data, vegetation changes) from satellite images were combined with data on water pipelines owned by the water utility to determine potential leakage areas.
As a result of determining 249 potential leakage zones throughout Toyota City, leakage surveys (road surface acoustic surveys) were conducted in 249 potential leakage zones, of which leaks were confirmed in 77 locations in 65 zones (a 30% accuracy rate). Compared to the demonstration experiment conducted in Toyota City in the past, the area that can be determined per area has been narrowed from a circle with a diameter of 200m to approximately 100m square, and the area to be surveyed for leaks has been reduced to approximately one-third of its original size, further improving the survey efficiency.
Q5. How is the judgment actually carried out using the tool?
<Analysis> What ordinary maps cannot do is: ・Search for locations where the temperature of the ground surface is 15 degrees Celsius or higher from within a specified area.
Calculation example of similarity (search for precipitation and temperature) of a location: Calculate the probability of similarity with the trend of precipitation, etc. in Toda City, Saitama Prefecture (where my club's dormitory is located).
The two are as follows.
<Maps> Maps published by the Geospatial Information Authority of Japan (GSI) can be displayed. Example: Land use map, etc.
<Layer> Geological maps, land use maps, vegetation maps, flood inundation maps, etc. are color-coded on the map.
Q6. What suggestions did you get?
We have grasped something like a software consultancy start-up pattern of combining existing issues + new data with existing data. Regarding Next Action, what kind of data can be obtained from existing water utility issues that have been qualitatively identified as issues but have not yet been incorporated into numbers? Personally, I think it would be interesting to reduce processing time by quantifying FAQs of calls from households.
The system is intuitive and very easy to operate. (I could use it even if I didn't know how to operate it.) → I realized the importance of user testing.
It is important to design the necessary data and formulate a hypothesis of the consideration to be obtained. It is important to know which cloud (data) to find or combine to get the part of rain (suggestion) and umbrella (next action).
→In this case, we can superimpose flood maps, land use maps, and precipitation data to find out where there is little precipitation, but where there is danger.
Similarity Analysis of Heaven, Earth, and People
Heaven, Earth, and Human Condition Analysis
Thank you for reading.