
【networkx igraph】networkxとigraph間でデータをやりとりする【python】
【はじめに】
※再掲部分もありますが、今回はmatplotlib, networkx, igraphの3つを説明に盛り込んだのでボリュームが少し多いです。
前回は「igraph」、更にその前は「networkx」を使ったプログラムを紹介した。
どっちのライブラリの方が優れているか、という話ではなく、どちらもよい部分・苦手な部分があることを踏まえて使いこなせると本当はいい。
・・・とはいえ実際の所、両方ともマスターするための時間を確保するのはなかなか難しい。
そこで今回は、『部分的に「igraph」を使ったり、「networkx」を使ったりする』ということを想定して、「networkx」と「igraph」間でデータをやり取りしてみる。
【例題】最大フロー問題(最大流問題)
例題は、「networkx」の記事で使用した「最大フロー問題(最大流問題)」を使っていく。
※再掲
■ 問題
「拠点x → 拠点y」へ「資源」を運びたい。
ルートは以下の図のようになっていて、
・「中継地点:0~3」が存在する。
・「各拠点間」には「数字で記載された輸送量上限」がある。(※)
※例えば「拠点x と拠点1」の間では、輸送上限量は「13」になっている。
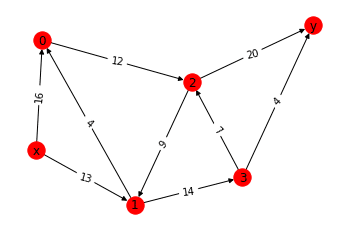
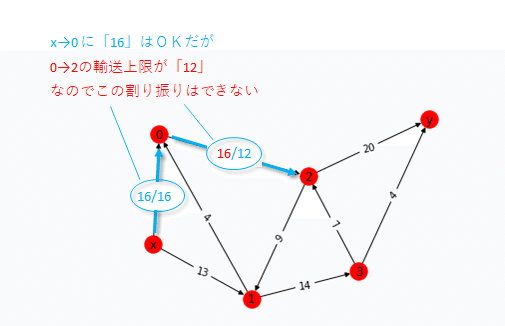
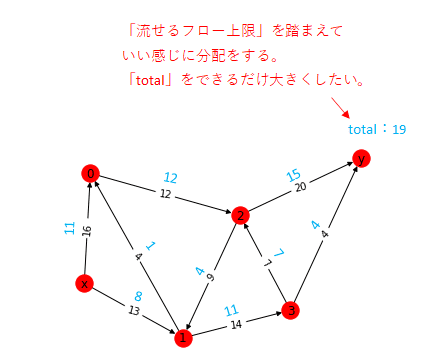
各ルートの輸送上限は越えられない。それを踏まえつつ、
いい感じに輸送量を分配して、拠点x → 拠点y に輸送する量をできるだけ大きくしたい。
【今回のやり方】
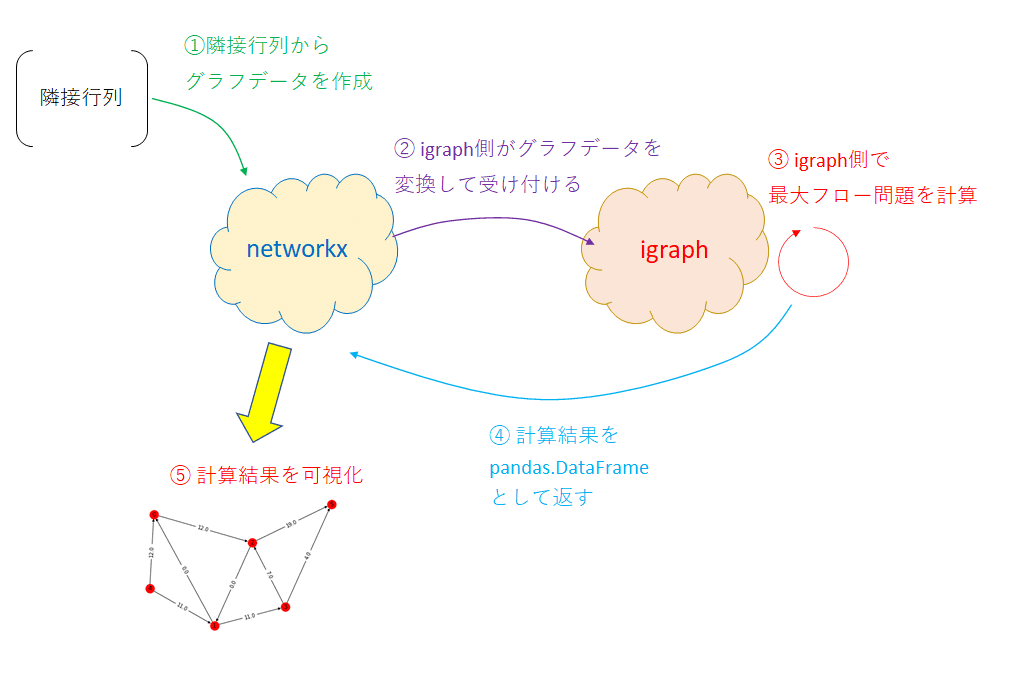
今回は次のような事をしてみる
①「networkx」で「グラフデータ」を作成する
②「networkx」のデータを「igraph」で受け付ける
③「igraph」で「最大フロー問題(最大流)」を計算する
④「igraph」から「networkx」にデータを戻す
⑤「networkx」で結果を可視化してみる
※イメージ図
【解答例】
実行環境は「Google Colab」
■インストール
#!pip install matplotlib
#!pip install --upgrade matplotlib
#!pip install networkx
#!pip install --upgrade networkx

!pip install igraph
!pip install --upgrade igraph▲GoogleColabにはmatplotlib, networkxはインストールされているので、実行しなくても問題ない。
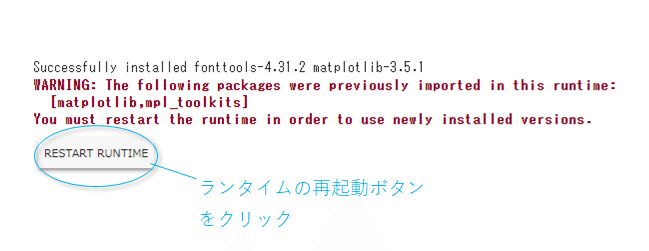
※「upgradeオプション」により『ランタイムの再起動が必要、という旨のメッセージ」とともに「ランタイム再起動ボタン」が出現することがある。→ その場合は再起動ボタンをクリックしてすすめていけばよい。
※初めから入っているcolab上の「matplotlib」をupgradeしようとした場合
■マジックコマンドについて
引き続き、Jupyter用のマジックコマンドを実行する。
※補足:matplotlibのbackend(バックエンド)
説明なく「マジックコマンド」と簡単に書いているが、これは「matplotlib」のバックエンドを設定しているものである。
「matplotlib」の「バックエンド」の詳細は以下の通り。
要は何かしらを描画するときに、「別ウィンドウを立ち上げるのか/ブラウザ上に埋め込むのか」、「画像として表示するのか/インタラクティブ性(マウスやキーボードで何かしら操作可能)をもたせるのか」、等のようなことをを設定している、というもの。
なお、「% matplotlib 〇〇」というマジックコマンド自体は「IPython」の仕組みを使ったもので、具体的なコードは以下参照。
※2022年4月2日時点では、GoogleColab上のIPythonはver.5.5のままずっとアプデされていない。(Python 2.7と互換性を維持しているため)
■matplotlibで利用可能なバックエンドを確認
%matplotlib --list【実行結果例】
Available matplotlib backends: ['tk', 'gtk', 'gtk3', 'wx', 'qt4', 'qt5', 'qt', 'osx', 'nbagg', 'notebook', 'agg', 'inline', 'ipympl', 'widget']
■Colab上での現在のmatplotlibのバックエンドを確認する
import matplotlib

matplotlib.get_backend() # 現在のバックエンドを確認【実行結果例】
module://ipykernel.pylab.backend_inline
▲この結果の通り、実は「Google Colab」では、はじめから「%matplotlib inline」相当のものが設定されている。
■Jupyter用マジックコマンド等を仕込む
※上記の説明の通り、Colab上では「%matplotlib inline」がはじめから設定されているため、やらなくてもOK
%matplotlib inline
import matplotlib.pyplot as plt
#import seaborn as sns
#sns.set()【1】「networkx」で「グラフデータ」を作成する
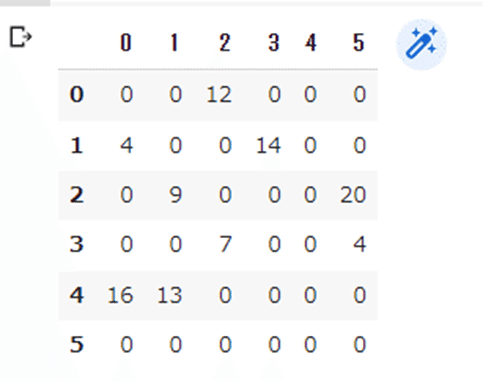
今回は「networkx」の記事と同様に、「pandas」で「隣接行列」を作成して、それを「networkx」で読み込ませる。
■pandasで隣接行列を作成
import pandas as pd

# DF作成
my_sample_data_df = pd.DataFrame([
    [0,0,12,0,0,0],
    [4,0,0,14,0,0],
    [0,9,0,0,0,20],
    [0,0,7,0,0,4],
    [16,13,0,0,0,0], # 拠点x 相当
    [0,0,0,0,0,0], # 拠点y 相当
])

my_sample_data_df【実行結果例】
■隣接行列(DataFrame)の読み込み
import networkx as nx


# 隣接行列(DataFrame)の読み込み
G = nx.from_pandas_adjacency(my_sample_data_df, create_using=nx.DiGraph)

# 必要に応じてグラフに名前を設定する
G.name = "Graph from pandas adjacency matrix"
print(nx.info(G))

print( G.nodes(data=True) ) # node情報を取得(属性も含む)
print( G.adj )# 隣接情報(重みの属性)を確認【実行結果例】
DiGraph named 'Graph from pandas adjacency matrix' with 6 nodes and 9 edges
[(0, {}), (1, {}), (2, {}), (3, {}), (4, {}), (5, {})]
{0: {2: {'weight': 12}}, 1: {0: {'weight': 4}, 3: {'weight': 14}}, 2: {1: {'weight': 9}, 5: {'weight': 20}}, 3: {2: {'weight': 7}, 5: {'weight': 4}}, 4: {0: {'weight': 16}, 1: {'weight': 13}}, 5: {}}
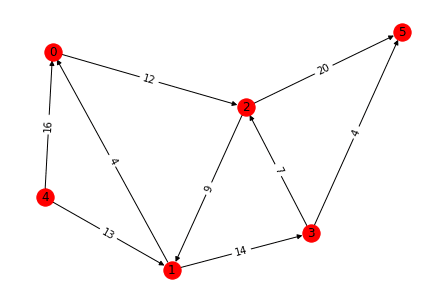
■読み込んだデータを描画する(エッジにweight値も付与)
# 「グラフG」の「属性(attribute)名:weight」取得
labels = nx.get_edge_attributes(G,'weight')
print(labels)

# いい感じの表示になるように適当に用意した描画位置データ
pos = {
    0: [-0.77069852,  0.36290033],
    1: [-0.16543567, -0.4545243 ],
    2: [0.2083616 , 0.15452308],
    3: [ 0.53878648, -0.31734415],
    4: [-0.81101389, -0.18321122],
    5: [1.        , 0.43765626]
}


# 以下の通り可変長引数「**kwds」を利用して設定値分離でもOK
other_param={
    "node_color":"red",
    "with_labels":True
}


nx.draw(G, pos, **other_param) # グラフ自体の描画
nx.draw_networkx_edge_labels(G, pos, edge_labels = labels) # edgeのラベル(重み)部分の描画【実行結果例】
{(0, 2): 12, (1, 0): 4, (1, 3): 14, (2, 1): 9, (2, 5): 20, (3, 2): 7, (3, 5): 4, (4, 0): 16, (4, 1): 13}
{(0, 2): Text(-0.28116846, 0.258711705, '12'), (1, 0): Text(-0.46806709500000004, -0.045811985, '4'), (1, 3): Text(0.18667540499999996, -0.38593422499999996, '14'), (2, 1): Text(0.021462965, -0.15000060999999998, '9'), (2, 5): Text(0.6041808, 0.29608967, '20'), (3, 2): Text(0.37357404, -0.08141053499999999, '7'), (3, 5): Text(0.76939324, 0.060156055000000014, '4'), (4, 0): Text(-0.7908562050000001, 0.08984455499999999, '16'), (4, 1): Text(-0.48822478, -0.31886776, '13')}
【2】「networkx」のデータを「igraph」で受け付ける
ここからは「igraph」側の話になる。
「networkx」で作成したグラフデータを「igraph」で受け付けるには「igraph.Graph.from_networkx()」を使う。
※networkx側ドキュメントの説明
ようするに、igraph側が変換する関数を持っている、ということ。(networkx側はもっていない)
※igraph.Graph.from_networkx()
■networkxで作成したデータを読み込む
ここから先は
¥ 100
もっと応援したいなと思っていただけた場合、よろしければサポートをおねがいします。いただいたサポートは活動費に使わせていただきます。
