【FOOTBALL】New Indicator of Passing Based on The Opponent's Block

Introduction
This article is quite challenging for me, because this is the first time for me to write about football in English and the content of this article is also my first time. What I want to introduce in this article is an indicator which I initiated. However I’m not a statistician and I’ve never studied statistics. Therefore there should be some defects. In this article, I’d like to introduce the idea and method of the indicator.
The Reason Why I Created New Pass Indicator
There have been a lot of datas about football like shots, passes and ball possession. Furthermore some indicators have been invented over the past decades. As a result, there are too much datas to find which is the most important. As you know, a team which can possess a ball can’t win a game. In fact, the Italian national team was defeated by North Macedonia in spite of 65% ball possession.
So, the question that I had was “which is the most appropriate indicator for performance evaluation?” One answer is xG, I suppose. xG is an indicator which shows the possibility of goal based on distance and angle of the shooting position from the goal and other factors. The reason why I think xG is the most suitable indicator for performance evaluation is that it includes a factor “opponents”, such as the position and the number. However xG evaluates only shooting situations, not entire performance like building up. Thus, I decided to create a new pass indicator that enables us to evaluate the entire performance based on opponents.
What is the New Pass Indicator EPP?
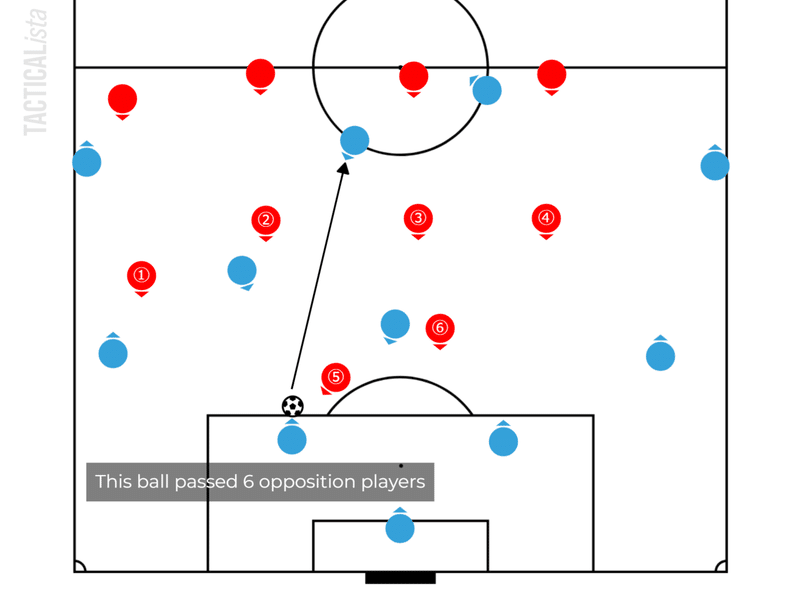
・Packing Rate that Shows Effective Passes
I referred to Packing Rate in developing the new indicator. Packing Rate is an indicator which evaluates passes according to the number of opponents that one pass passed. It means a pass through more opponents is a more effective pass. In addition, whether the player receiving the ball looks forward is also an important factor. Packing Rate contributes to evaluate not only players who pass a ball but also those who receive a ball.
While Packing Rate uses the number of opponents as an evaluation criterion, the new indicator uses the space between opponents. The name is EPP, it stands for “Effective Pass Point” which literally shows how effectively one team passed.
・Four Kinds of Spaces based on the Opponents
The first step of EPP is to divide into some spaces. Basically systems of the defending team have three lines such as 4-4-2 and 5-4-1. Therefore the spaces are split based on the opposition team’s line. Let’s take a look at an example of 4-4-2.
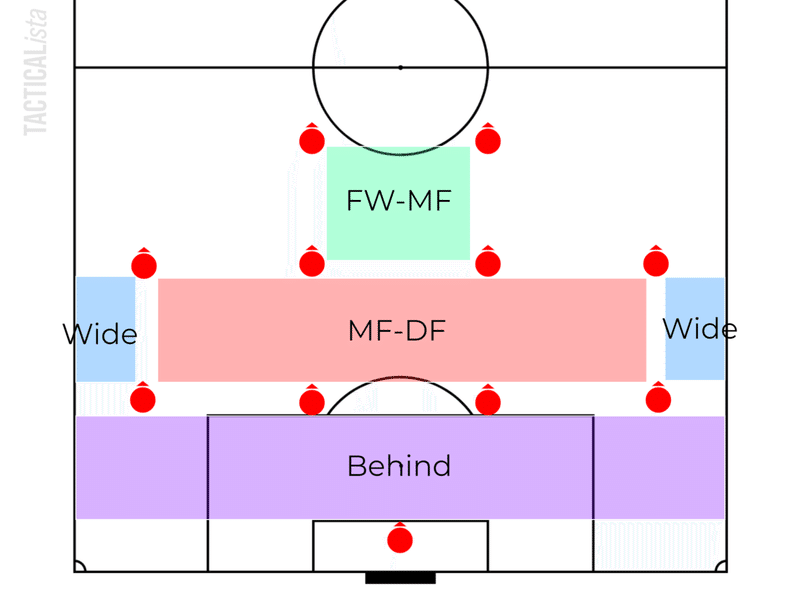
As you can see, there are four kinds of spaces. I want to give an additional explanation about FW-MF and MF-DF spaces. FW-MF space is between the lines forward and midfield. Similarly, MF-DF space is between the lines midfield and defender. Let's have a look at another example of 5-4-1.
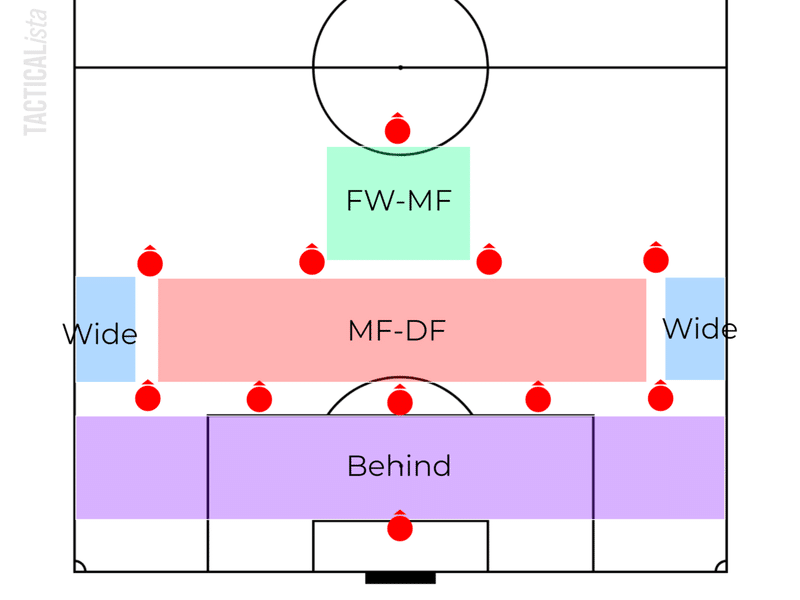
In the case of 5-4-1, the spaces are divided into five spaces as well as 4-4-2.
The most important point of this way is that these spaces are dynamic. Consequently, if the block is not compact, the spaces are recognised to be larger. This applies not only to the entire block, but also to a part of it. Here is an example.

The right central midfielder of the red team is marking the left central midfielder of the blue team tightly. Then, there is a vast space behind them. The blue player who is positioning between the lines can receive the ball in the vast space via left full-back. Thus Each space varies depending on the positioning of the opponents.
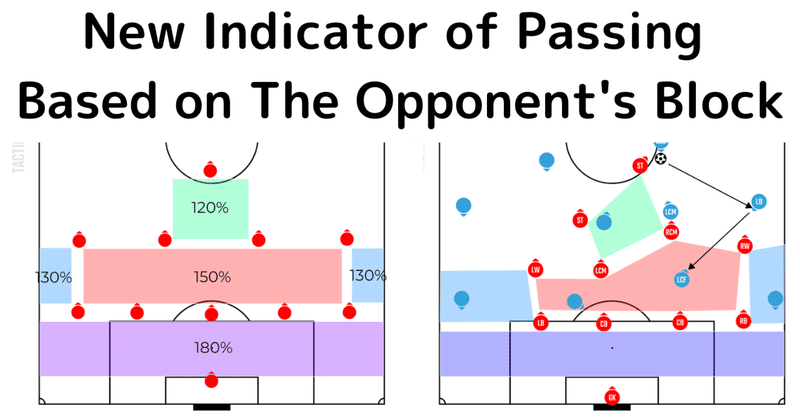
・How to Calculate EPP
The second step is to count the number of passes to each space. After that the passes are multiplied by a set multiplier for each space and converted into points. The diagram below shows the multipliers.

These multipliers are determined by the priority of the attack. The higher priority of the attack is, the more difficult to pass into the spaces and the more likely to shoot. Therefore the space which is higher priority is a higher multiplier.
In addition, it is necessary to calculate depending on the direction of the next play of the player who receives the ball. If the player plays forward, the point is 100%. If the player plays horizontally, it is 75%. If the player plays backwards, it is 50%.

The table above illustrates the way to calculate all steps.

There are two examples. The first example is that the left full-back passes to the attacking midfielder, but the player passes backwards to left centre midfielder. In this case, the calculation formula for EPP is 1.5 × 0.5 = 0.75 . The second example is that the left full-back passes to the left winger and the player dribbles forwards. In this case, the calculation formula for EPP is 1.3 × 1.0 = 1.3 .
By the way, I decided the multiplier of the four spaces and direction of play with not statistics but my intuition. Actually, I wanted to decide with big data. However, there are not any available sources that depend on this method. Therefore, these multipliers are not proper figures. Moreover, I counted EPP with my own hands watching some matches. Accordingly it was impossible to collect enough to confirm its accuracy. This is why I mentioned at the beginning that I’d like to introduce the idea and method of the indicator in this article.
Analysis of the Two Derbies in Premier League with EPP
In this section, I’m going to analyse the two derbies in Premier League, North London derby and Manchester derby with EPP, which were counted for all players as passer and receiver respectively. Only sub players with EPP above 2.0 are shown.
・North London Derby
Overall, Arsenal possessed the ball 65%, and completed passes with 90% accuracy. That means Arsenal dominated the game. Actually, Arsenal’s EPP was 55.4 and that of Tottenham’s was 32.9. Of course Royal’s red card is one of the factores, but Let’s take a look at how The Gunners defeated Tottenham with EPP.

First of all, let’s compare two full-backs. While Zinchenko’s Passer EPP was 12.6, that of White’s was 3.5. This means Zinchenko’s role was more attacking than White. In fact, average players' positions from Whoscored.com shows that Zinchenko played more narrowly than White.
The most notable thing is Jesus’s Receiver EPP which is the highest number in this game. Tottenham played very defensively and their wide-forwards defended very deeply to help their wing-backs. This caused the two pivots Højbjerg and Bentancur to deal with Arsenal’s full-backs who positioned centrally and two number 8s who moved around. For example, if Bentancur pressed Zinchenko or Xhaka, there was a vacant space behind him. In this situation, Jesus dropped to the space and received a pass from Zinchenko or Partey. This is the reason why Jesus received passes most effectively. This scenario happened particularly on the left side. Ødegaard’s and White’s EPP were, however, lower than the left side. In other words, Arsenal played less effectively on the right side than the left side.
Next, let’s have a look at the Spurs. They didn't complete that many passes, therefore, it's difficult to analyse them from the EPP alone, but we can find out a few things. While Son Heung-Min’s and Kane’s Passer EPP were exceedingly higher than that of Richarlison’s, their Receiver EPP were lower than his. This means Heung-Min and Kane played as the starting point in the counter attack situation and Richarlison was involved in shooting opportunities.
・Manchester Derby
On the whole, this game was dominated by blue Mancunians. In fact City's EPP was 58.9 which is approximately twice as that of United's, despite the fact that City completed 485 passes and United completed 408 passes with no significant difference. How did City create a lot of opportunities?

Grealish dribbled three times and completed three keypasses. In order to create opportunities, Grealish received passes higher up to the pitch. Therefore, his Receiver EPP was 14.7 which is the highest number in this game. On the other hand, Foden didn’t dribble and complete keypasses at all, but hit six shots. Consequently, he focused on not creating chance but shooting opportunities and his Receiver EPP was lower than that of Grealish’s. Instead of Foden being more involved in shooting opportunities, De Bruyne created more chances on the right side. Consequently, his Passer EPP was 12.8 which is the highest number in this game.
Why didn’t United play well in contrast to City? Their left side players’ such as Martínez, Malacia and Shaw Passer EPP were almost the same as that of City’s back four. However, the difference with City was attacking players’ Passer EPP. Although all City’s attacking players’ Passer EPP were above 3.0, they were all below 3.0 in United’s case. Therefore, the reason why United didn't create more opportunities was that attackers did not play well together.
Conclusion
In conclusion, The new pass indicator EPP which I created was for evaluation of team performance. However there are lots of ways to utilise it. For example, if the opposition's EPP is higher, it means they couldn’t defend effectively. In addition, EPP enables us to evaluate players as good passers and receivers as I analysed two derbies in this article. Therefore I think EPP is better for some purposes.
Finally, thank you for reading my first article in English, in spite of my terrible English and not being a professional statistician.
References
この記事が気に入ったらサポートをしてみませんか?