
PythonでWebの読み込み時間計測

はじめに
ネットワークエンジニアをしていますと、Webページの読み込みの時間を測定したいときがあります。
ネットワーク回線のレスポンスを知りたいとき、公開しているWebページのレスポンスを知りたいときなど、サービスを測定する必要が出てきます。
ブラウザには測定ツールも備わっておりますので、「F12キー > Networkタブ」から呼び出すこともできます。(図1はGoogle Chromeの場合)
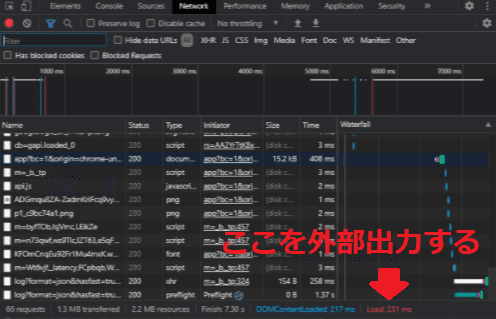
図1 ブラウザのNetwork測定
しかし、100回の平均値が欲しいと思ったとき、20:00~22:00でサービスの低下が起きていないか確認したいとき、データとして出力するのは困難になるかと思います。
世の中にはそのような有料ツールもあるかと思いますが、簡易的でよいので無料で出力できないかと思いましたので、作成することにしました。
例:HttpWatchの有料版
無料版は出力に対応しておりませんでした。
※Webスクレイピングに該当しますので、本コードでアクセスする際は、各ページの規約等をご確認していただければと思います。
コードの紹介
それぞれをコピーしてご利用いただければと思います。
注意点としましては、seleniumのインストールが必要となります。(インストール方法は以前の記事をご参照ください)
毎度おなじみ、動画もございますのでイメージをお伝えできればと思います。
Python_Info.py
#-------------------基本情報--------------------

#chrome driver
DriverDir = r"C:\Users\■■■\デスクトップ\python\driver\chromedriver.exe"

#デスクトップ指定
DeskTopDir = r"C:\Users\■■■\デスクトップ"
http_response.py
# -*- coding: utf-8 -*-
#-----------------------------------

#基本情報
import Python_Info

#webアクセス
from selenium import webdriver
from selenium.webdriver.common.desired_capabilities import DesiredCapabilities
from webdriver_manager.chrome import ChromeDriverManager

#時間
import time
import datetime

 #json import json

#OS
import subprocess

#デバッグ用
import pprint

#-----------------------------------

accsess_url = [
   "https://www.yahoo.co.jp",
   "https://note.com/",
   "https://qiita.com/"
   ]

proxy = [
   "http://10.0.0.1:8080",
   "http://10.0.0.2:8080"
   ]

#-----------------------------------


###################################
#
#関数
#  指定のファイルへ書き込み
#  メモ帳で開く
#
###################################

def file_write(writeFilePath, str):

   #書き込み
   with open(writeFilePath, 'a') as f:
       f.writelines(str)


###################################
#
#関数
#  "message"というプロパティを抽出
#
###################################

def process_browser_log_entry(entry):

   #messageのmessageを抽出
   response = json.loads(entry['message'])['message']

   #戻り値
   return response


#######################
#
#メイン関数
#  Webサイトの読み込みURLを取得
#  読み込み終了 - 開始時間でレスポンス測定
#
#######################

def main():

   #日付取得
   tm = datetime.datetime.now().strftime('%m%d_%H%M')

   #ログ
   logTxt = ''

   #セット回数
   for i in range(100):

       #各proxyを利用
       for p in proxy:

           #各URLへアクセス
           for u in accsess_url:

               #capabilityオプションを指定
               caps = DesiredCapabilities.CHROME
               caps["goog:loggingPrefs"] = {"performance": "ALL"}

               #WebDriverのオプション指定
               options = webdriver.ChromeOptions()
               options.add_argument('--ignore-certificate-erroes') #証明書エラー回避
               options.add_argument('--incognito') #シークレットモードの設定付与
               #options.add_argument('--proxy-server=' + p) #プロキシ設定

               #ブラウザ立ち上げ
               driver = webdriver.Chrome(Python_Info.DriverDir, options = options, desired_capabilities = caps)
               driver.implicitly_wait(2)

               #URLアクセス
               driver.get(u)
               print('\nURL = ' + u)
               time.sleep(3)

               #JSONのフォーマット
               netLog = driver.get_log("performance")

               #JSONのperformanceを抽出
               events = [process_browser_log_entry(entry) for entry in netLog]

               #"method"名にNetwork.responseReceived含むものを抽出
               events = [event for event in events if 'Network.respons' in event['method']]

               #各performanceからタイムスタンプとURLを抽出
               detected_url = []
               timestamp_url = []
               for item in events:
                   if "response" in item["params"]:
                       if "url" in item["params"]["response"]:

                           #詳細のアクセスURL
                           detected_url.append(item["params"]["response"]["url"])

                           #timestamp
                           timestamp_url.append(item["params"]["timestamp"])


               #詳細のアクセスURL数
               n = len(detected_url)

               #アクセストータル時間
               totaltime = float(timestamp_url[n - 1]) - float(timestamp_url[0])
               totaltime = round(totaltime, 2) #小数点第2位

               #表示
               print('records:', n)
               print('start time:', timestamp_url[0])
               print('end time:', timestamp_url[n - 1])
               print('total time:', totaltime, '\n')

               #ログ作成
               logTxt = logTxt + '\n' + str(totaltime) + '\n' #レスポンスタイム

               #書き込み
               file_write(Python_Info.DeskTopDir + '\\web_response' + tm + '.log', logTxt)

               #ブラウザ閉じる
               driver.quit()


   #メモ帳で開く
   subprocess.Popen('C:/Windows/notepad.exe ' + Python_Info.DeskTopDir + '\\web_response' + tm + '.log', logTxt)


#おまじない
if __name__ == "__main__":
   main()
本コードは下記の資料をもとに作成しております。
Selenium Webdriver ページの読み込み時間の計測
https://qiita.com/nd-02110114/items/0a078973494f19a0b27f
コードの仕組み
今回は複雑なので、1行1行のコードの解説を省略させていただきます。
まず、Networkのパフォーマンスログはどのように取得できるかといいますと、次のコードとなります。
JSON形式となりますので、pprintで出力されると見やすいかと思います。
#JSONのフォーマット
netLog = driver.get_log("performance")

#中身の確認
pprint.pprint("netLog")
ただし、情報が膨大となりますので、絞っていかなければなりません。
そこに該当するコードは次の通りです。
#######################
#
#関数
#  "message"というプロパティを抽出
#
#######################

def process_browser_log_entry(entry):

   #messageのmessageを抽出
   response = json.loads(entry['message'])['message']

   #戻り値
   return response


#JSONのperformance内のeventを抽出
events = [process_browser_log_entry(entry) for entry in netLog]


#"method"名にNetwork.responseReceived含むものを抽出
events = [event for event in events if 'Network.respons' in event['method']]


#各performanceからタイムスタンプとURLを抽出
detected_url = []
timestamp_url = []
for item in events:
   if "response" in item["params"]:
       if "url" in item["params"]["response"]:

           #詳細のアクセスURL
           detected_url.append(item["params"]["response"]["url"])

           #timestamp
           timestamp_url.append(item["params"]["timestamp"])
JSONは階層となりますので、item["params"]["response"]["url"]のような抽出方法となります。
==================
※JSON形式のイメージ
==================
'method' : 'Network.responseReceived' ,
'params' : {'frameid' : 'BDA7' ,
'loderid' : 'C188' ,
'requestid' : '9878.6' ,
'response' : {'connectionid' : '67' ,
-省略-
'timing' : {} ,
'url' : 'https://google.com' }
'timestamp' : '703617.654937' ,
'type' : 'Script' } }
次に、ほかのPythonファイルを呼び出す試みを行いました。
この利点としましては、コードを公開する際に誤ってID、パスワードを流出しないようにすることにあります。
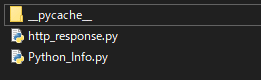
図2 ディレクトリ内のPythonファイル
http_response.py
#基本情報
import Python_Info

#ブラウザ立ち上げ
driver = webdriver.Chrome(Python_Info.DriverDir, options = options, desired_capabilities = caps)

#書き込み
file_write(Python_Info.DeskTopDir + '\\web_response' + tm + '.log', logTxt)
Python_Info.py
#chrome driver
DriverDir = r"C:\Users\■■■\デスクトップ\python\driver\chromedriver.exe"

#デスクトップ指定
DeskTopDir = r"C:\Users\■■■\デスクトップ"

UserName = "しゃけしゃけ"
PassWord = "■■■"
import Python_Info と記述をいただければ、ほかのライブラリと同様にご利用いただけます。
呼び出し方は、Python_Info.DriverDirのように「ファイル名+ドット+変数名」で参照可能です。
最後に
本コードを利用する方は、ぜひSNS等でご紹介いただければと思います。
学術論文には、無料で公開されているものが多くあり、どれだけほかの論文の参考にされているかの指標がございます。(参考文献に書かれた回数が多いほど、優れた研究をされていると評価されます。)
無料で公開されているプログラムコードにも当てはまることだと思いますので、どれだけ拡散されたがが見えると嬉しいです。
また、1行1行の解説も公開する予定になりますので、気になる方がいましたら来てください。
サポートしてくださるお気持ちだけで嬉しいです。