Local-LLMで特許文献整理

Bertopicで特許文献の整理をしてみました。
分類するため、要約にZephyr-7B-βを、要約文のembeddingにbge-large-en-v1.5を使用しました。
対象は、最近また騒がしい半導体を勉強がてら使用しました。
0. 環境
OS:Windows
CPU:Intel(R) Core i9-13900KF
RAM:128GB
GPU:RTX 4090
1. 特許情報取得
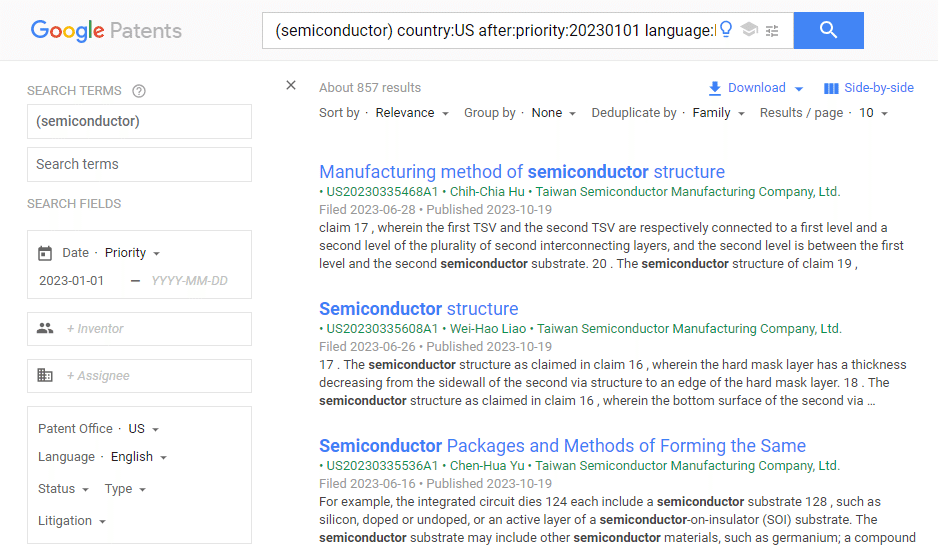
Google Patentsで「(semiconductor) country:US after:priority:20230101 language:ENGLISH」でヒットした857件を対象にしました。
2. 明細文要約
LLMのmodel
import torch
from transformers import pipeline

pipe = pipeline("text-generation", model="HuggingFaceH4/zephyr-7b-beta", torch_dtype=torch.bfloat16, device_map="auto")
要約
sum_texts = []
approach_texts = []

for i in tqdm(range(len(df))):
    text = df['description'][i][:10000] # 明細文の冒頭10000文字を使用
    try:
        messages = [
            {
                "role": "system",
                "content": "You are an excellent technician, have a deep understanding of patents in particular, and always give careful, accurate and clear replies.",
            },
            {"role": "user", "content": f"Please summarize the patent specification section below, using bullet points to identify the main purpose and means used.\n-----\n{text}"},
        ]
        prompt = pipe.tokenizer.apply_chat_template(messages, tokenize=False, add_generation_prompt=True)
        outputs = pipe(prompt, max_new_tokens=2048, do_sample=True, temperature=0.7, top_k=50, top_p=0.95)
        summary = outputs[0]["generated_text"][outputs[0]["generated_text"].find('<|assistant|>')+14:]
        sum_texts.append(summary)
        pickle.dump(sum_texts, open(f"{path}/summary.pkl", 'wb')) # 一次要約を保存

        messages = [
            {
                "role": "system",
                "content": "You are an excellent technician, have a deep understanding of patents in particular, and always give careful, accurate and clear replies.",
            },
            {"role": "user", "content": f"Below is the summary text of the patent. Please itemize the measures proposed within that text into 5 to 10 items.\n-----\n{summary}"},
        ]
        prompt = pipe.tokenizer.apply_chat_template(messages, tokenize=False, add_generation_prompt=True)
        outputs = pipe(prompt, max_new_tokens=2048, do_sample=True, temperature=0.7, top_k=50, top_p=0.95)
        approach = outputs[0]["generated_text"][outputs[0]["generated_text"].find('<|assistant|>')+14:]

        approach_texts.append(approach)
        pickle.dump(approach_texts, open(f"{path}/approach.pkl", 'wb')) # 今回使用する要約文を保存
    except:
        sum_texts.append("")
        approach_texts.append("")
3. 分類
Bertopicが便利なので、Bertopicを使用。
embeddingにはBAAI(北京智源人工智能研究院)のbge-large-en-v1.5を使用。
docs = pickle.load(open(f"{path}/approach.pkl", 'br')) # データの読み込み


from bertopic import BERTopic
from bertopic.representation import KeyBERTInspired, MaximalMarginalRelevance

main_representation_model = KeyBERTInspired()
aspect_representation_model = [KeyBERTInspired(top_n_words=30),
                                MaximalMarginalRelevance(diversity=.5)]

representation_model = {
   "Main": main_representation_model,
   "Aspect":  aspect_representation_model
}

model = 'BAAI/bge-large-en-v1.5'
topic_model = BERTopic(verbose=True, embedding_model=model,
                       min_topic_size = 3,
                      representation_model = representation_model
                      )

topics, ini_probs = topic_model.fit_transform(docs)
最小クラスタの件数(min_topic_size)を3件は全体の1%以下とかなり小さいですが、私の好みです。
結果一覧
topic_model.get_topic_info()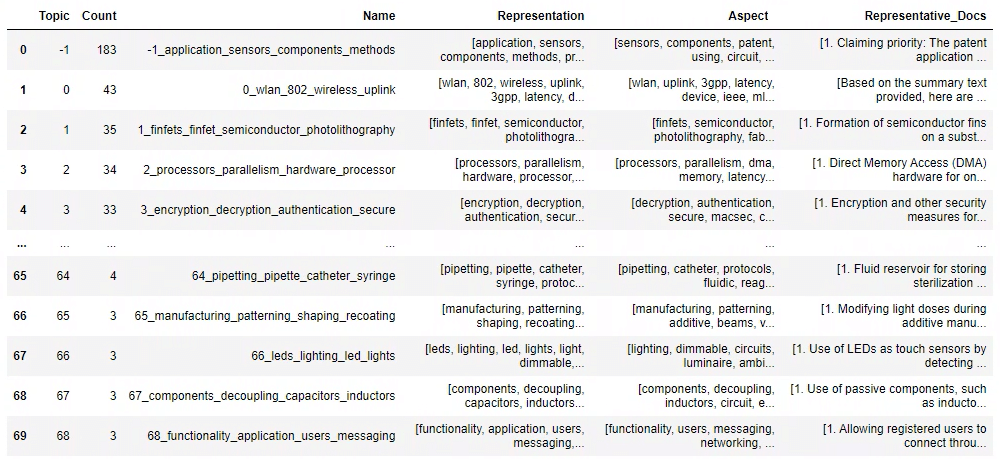
topic [-1] は未分類データで、それが183件と結構多いですが、そんなものです。こちらへの対応は後述します。
一般にはこのあと下記のDistance mapやSimilarity heat mapで近すぎるtopicをmergeしますが、半導体素人の私は内容見ないと判断できないので一旦そのままにしておきます。
topic_model.visualize_topics()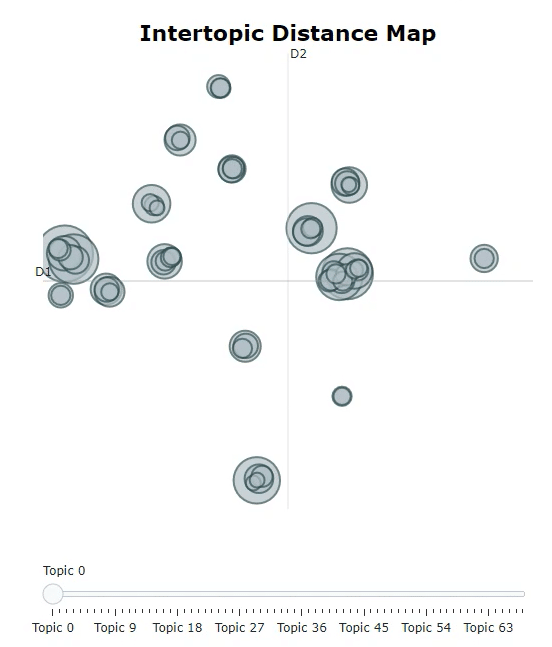
topic_model.visualize_heatmap()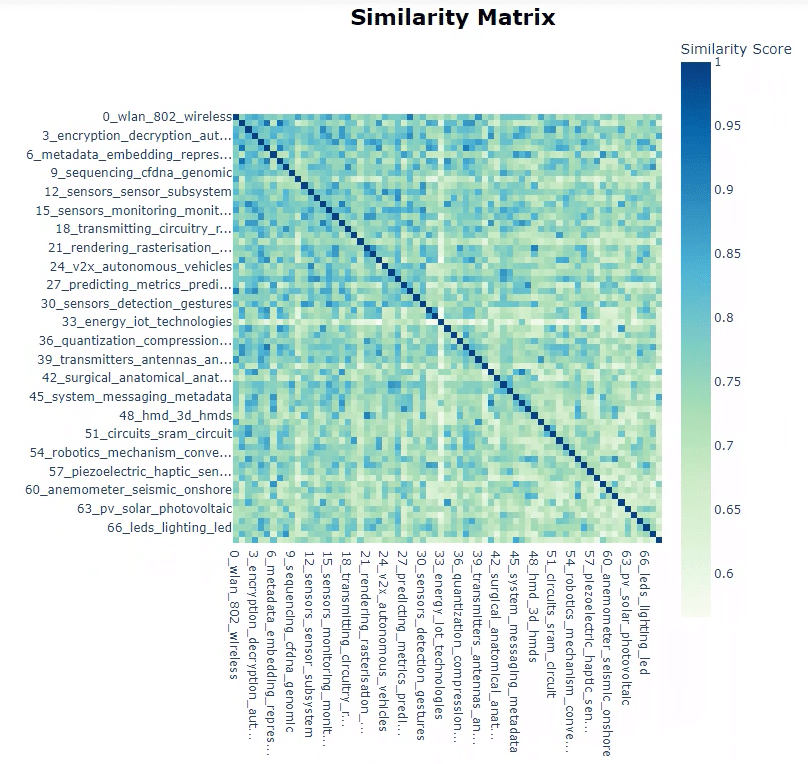
一応、topic間のcos類似度を並べておきます。
from sklearn.metrics.pairwise import cosine_similarity
distance_matrix = cosine_similarity(np.array(topic_model.topic_embeddings_))
dist_df = pd.DataFrame(distance_matrix, columns=topic_model.topic_labels_.values(),
                       index=topic_model.topic_labels_.values())

tmp = []
for rec in dist_df.reset_index().to_dict('records'):
    t1 = rec['index']
    for t2 in rec:
        if t2 == 'index':
            continue
        tmp.append(
            {
                'topic1': t1,
                'topic2': t2,
                'similarity': rec[t2]
            }
        )

pair_dist_df = pd.DataFrame(tmp)

pair_dist_df = pair_dist_df[(pair_dist_df.topic1.map(
      lambda x: not x.startswith('-1'))) &
            (pair_dist_df.topic2.map(lambda x: not x.startswith('-1')))]
pair_dist_df = pair_dist_df[pair_dist_df.topic1 < pair_dist_df.topic2]
pair_dist_df.sort_values('similarity', ascending = False).head(20)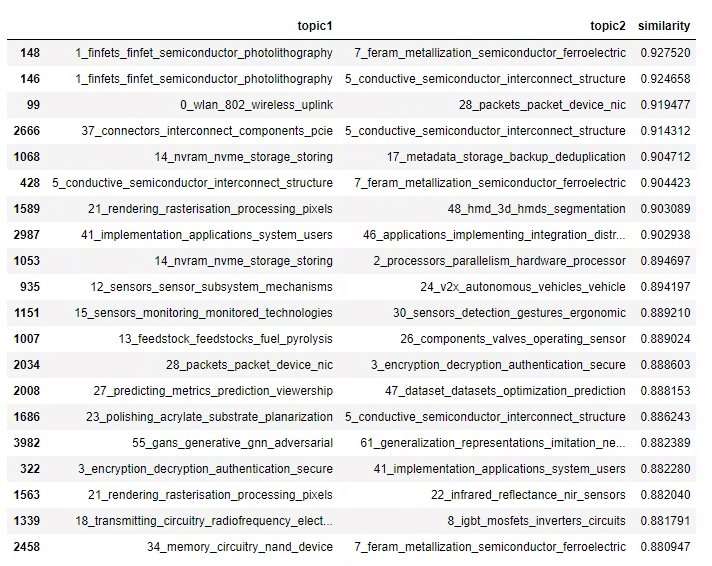
未分類件数を減らす手段の一つとして、各テキストに複数topicを振り分ける方法があります。普通どの特許も複数の観点を含むので、自然ですね。
topic_distr, topic_token_distr = topic_model.approximate_distribution(
      docs, window = 4, calculate_tokens=True)
import plotly.express as px
tmp_dfs = []
for thr in tqdm(np.arange(0, 0.35, 0.001)):
# calculating number of topics with probability > threshold for each document
tmp_df = pd.DataFrame(list(map(lambda x: len(list(filter(lambda y: y >= thr, x))), topic_distr))).rename(
columns = {0: 'num_topics'}
)
tmp_df['num_docs'] = 1
tmp_df['num_topics_group'] = tmp_df['num_topics']\
.map(lambda x: str(x) if x < 5 else '5+')
tmp_df_aggr = tmp_df.groupby('num_topics_group', as_index = False).num_docs.sum()
tmp_df_aggr['threshold'] = thr
tmp_dfs.append(tmp_df_aggr)
num_topics_stats_df = pd.concat(tmp_dfs).pivot(index = 'threshold',
values = 'num_docs',
columns = 'num_topics_group').fillna(0)
num_topics_stats_df = num_topics_stats_df.apply(lambda x: 100.*x/num_topics_stats_df.sum(axis = 1))
colormap = px.colors.sequential.YlGnBu
px.area(num_topics_stats_df,
title = 'Distribution of number of topics',
labels = {'num_topics_group': 'number of topics',
'value': 'share of reviews, %'},
color_discrete_map = {
'0': colormap[0],
'1': colormap[3],
'2': colormap[4],
'3': colormap[5],
'4': colormap[6],
'5+': colormap[7]
})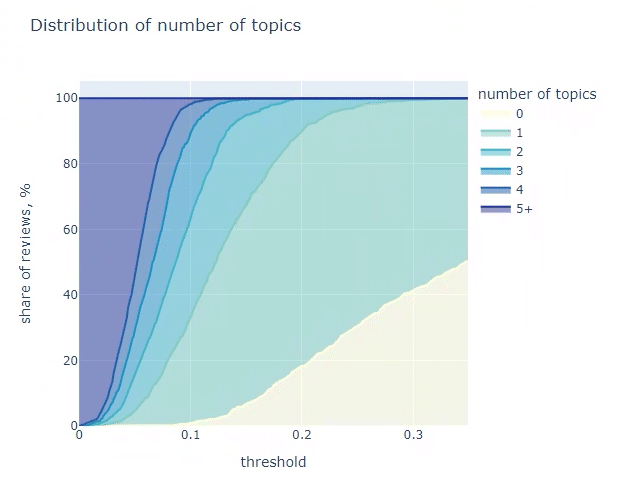
上図を見ると threshold=0.11 で未分類件数を全体の5%以下にすることができます。
threshold = 0.11
df['multiple_topics'] = list(map(
    lambda doc_topic_distr: list(map(
        lambda y: y[0], filter(lambda x: x[1] >= threshold,
                               (enumerate(doc_topic_distr)))
    )), topic_distr
))

tmp_data = []
for rec in df.to_dict('records'):
    if len(rec['multiple_topics']) != 0:
        mult_topics = rec['multiple_topics']
    else:
        mult_topics = [-1]

    for topic in mult_topics:
        tmp_data.append(
            {
                'topic': topic,
                'url': rec['url'],
            }
        )

mult_topics_df = pd.DataFrame(tmp_data)
4. 各topicのLLM命名
zephyr-7B-αでそれぞれのtopicに命名します。
今回はCPUで動かすため、Bloke兄さんの8bit量子化モデルを使用します。CPUにしたのに特に理由はありません。GPUをほかにリソース割くとか。
モデルの準備
from llama_cpp import Llama

model_path = r"C:\Users\--\Documents\LlamaCPP\model" # modelの保存フォルダ
model_name = "zephyr-7b-alpha.Q8_0.gguf"
llm = Llama(model_path=f"{model_path}/{model_name}", n_ctx=4096)
命名
zephyr_keywords = []
for i in tqdm(range(len(topic_model.get_topic_info()))):
    DOCUMENTS = topic_model.get_topic_info()["Representative_Docs"][i][0]
    KEYWORDS = topic_model.get_topic_info()["Aspect"][i]

    system_prompt = """
    <s>[INST] <<SYS>>
    You are a helpful, respectful and honest assistant for labeling topics.
    <</SYS>>
    """
    example_prompt = """
    I have a topic that contains the following documents:
    - Traditional diets in most cultures were primarily plant-based with a little meat on top, but with the rise of industrial style meat production and factory farming, meat has become a staple food.
    - Meat, but especially beef, is the word food in terms of emissions.
    - Eating meat doesn't make you a bad person, not eating meat doesn't make you a good one.

    The topic is described by the following keywords: 'meat, beef, eat, eating, emissions, steak, food, health, processed, chicken'.

    Based on the information about the topic above, please create a short label of this topic. Make sure you to only return the label and nothing more.
    [/INST] Environmental impacts of eating meat
    """
    main_prompt = f"""
    [INST]
    I have a topic that contains the following documents:
    {DOCUMENTS}

    The topic is described by the following keywords: '{KEYWORDS}'.

    Based on the information about the topic above, please create a short label of this topic. Make sure you to only return the label and nothing more.
    [/INST]
    """
    prompt = system_prompt + example_prompt + main_prompt

    output = llm(prompt, temperature=0.1, echo=True)
    keyword = output['choices'][0]['text'][output['choices'][0]['text'].rfind("\n")+1:]
    zephyr_keywords.append(keyword)

topic_model.set_topic_labels(zephyr_keywords)
5. 可視化
系統樹に各topicの特許件数を棒グラフで表現したものは下記の通りです。
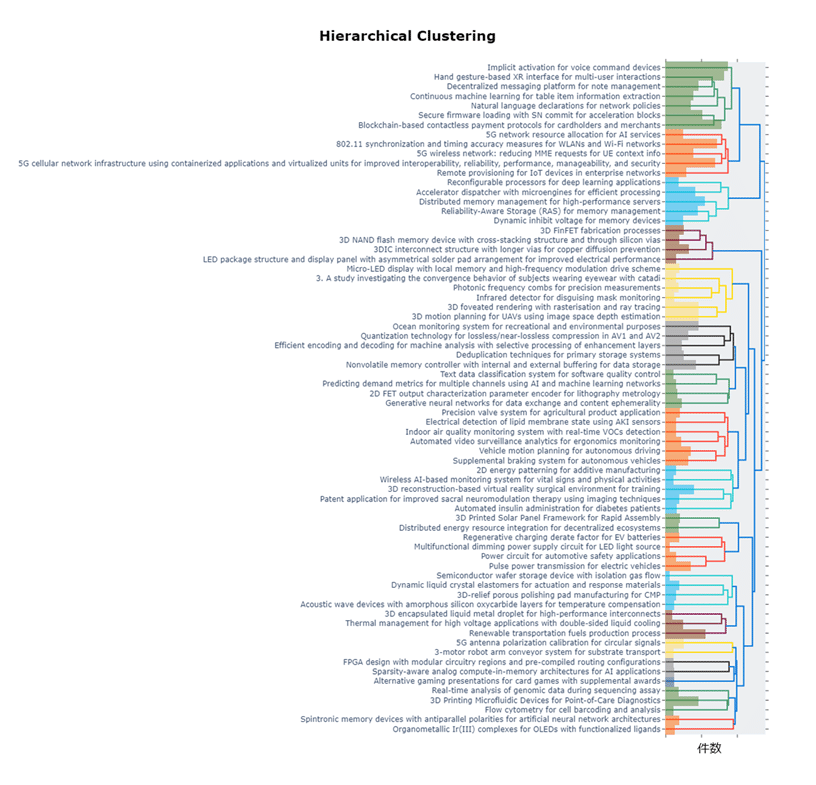
ひと目で、知らない業界の技術関係や注力のされ方を分かった気になれます。
6. 参考
この記事が気に入ったらサポートをしてみませんか?