open3d python depth画像とRGB画像からpoint cloudを可視化する

入出力
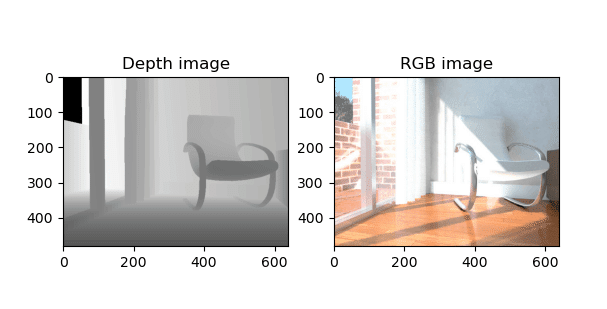
入力画像
深度画像:16bit tiff
RGB画像:24bit RGB (8bit ×3) tiff
(Redwood Dataset をtiffに変換して入力)
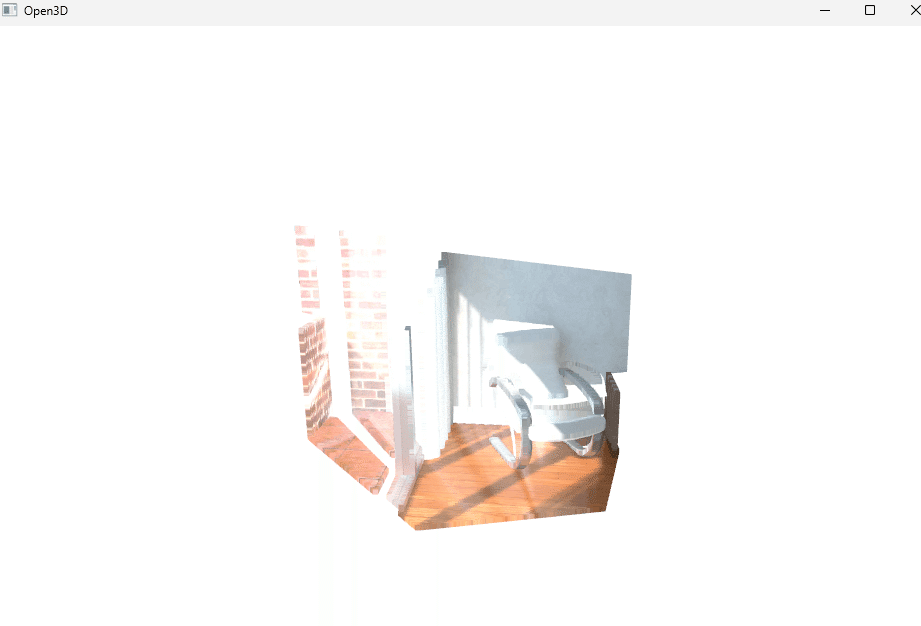
出力画像
PLYファイル
全コード
import numpy as np
import matplotlib.pyplot as plt
import open3d as o3d
import os
import cv2

if __name__ == "__main__":
    os.chdir(os.path.dirname(os.path.abspath(__file__)))

    # Camera parameters:
    FX_DEPTH = 5.8262448167737955e02
    FY_DEPTH = 5.8269103270988637e02
    CX_DEPTH = 3.1304475870804731e02
    CY_DEPTH = 2.3844389626620386e02

    # Read depth and color image:
    depth_image = cv2.imread("./depth_00000.tif", cv2.IMREAD_UNCHANGED)
    rgb_image = cv2.imread("./rgb_00000.tif", cv2.IMREAD_UNCHANGED)
    rgb_image = cv2.cvtColor(rgb_image, cv2.COLOR_BGR2RGB)
    print(f"type(depth_image):{type(depth_image)}")
    print(f"type(rgb_image):{type(rgb_image)}")
    print(f"depth_image.shape:{depth_image.shape}")
    print(f"rgb_image.shape:{rgb_image.shape}")
    print(f"depth_image.dtype:{depth_image.dtype}")
    print(f"rgb_image.dtype:{rgb_image.dtype}")

    depth_image = depth_image.astype(np.int32)
    rgb_image = rgb_image.astype(np.uint8)

    color = o3d.geometry.Image(rgb_image)
    depth = o3d.geometry.Image(depth_image.astype(np.uint16))

    # Display depth and grayscale image:
    fig, axs = plt.subplots(1, 2)
    axs[0].imshow(depth, cmap="gray")
    axs[0].set_title("Depth image")
    axs[1].imshow(color)
    axs[1].set_title("RGB image")
    plt.show()

    # compute point cloud:
    # Both images has the same resolution
    height, width = depth_image.shape
    pinhole_camera_intrinsic = o3d.camera.PinholeCameraIntrinsic(
        width, height, FX_DEPTH, FY_DEPTH, CX_DEPTH, CY_DEPTH
    )
    rgbd = o3d.geometry.RGBDImage.create_from_color_and_depth(
        color, depth, convert_rgb_to_intensity=False
    )
    pcd_o3d = o3d.geometry.PointCloud.create_from_rgbd_image(
        rgbd, pinhole_camera_intrinsic
    )

    # Convert to Open3D.PointCLoud:
    pcd_o3d.transform([[1, 0, 0, 0], [0, -1, 0, 0], [0, 0, -1, 0], [0, 0, 0, 1]])
    o3d.visualization.draw_geometries([pcd_o3d])
    o3d.io.write_point_cloud("test.ply", pcd_o3d)
出力例
注意点
下記でconvert_rgb_to_intensity=Trueにすると、Point Cloud 表示がモノクロになる。
rgbd = o3d.geometry.RGBDImage.create_from_color_and_depth(
    color, depth, convert_rgb_to_intensity=False
)
下記でo3d.geometry.Image形式に変換する際、uint8, uint16, or floatしか受け付けない。
depth = o3d.geometry.Image(depth_image.astype(np.uint16))opencvでRGB画像を読み込むとBGRで読み込まれる。cv2.cvtColorで変換が必要
    rgb_image = cv2.imread("./rgb_00000.tif", cv2.IMREAD_UNCHANGED)
    rgb_image = cv2.cvtColor(rgb_image, cv2.COLOR_BGR2RGB)
参考
この記事が気に入ったらサポートをしてみませんか?