
Pythonライブラリ(可視化):Matplotlib_アニメーションの作成

1.概要
前回記事ではMatplotlibの基礎を学びましたが今回は応用でAnimation(動画およびGif)を作成します。モジュールは"matplotlib.animation"を使用していきます。
2.全般知識
2-1.animationクラスの説明
クラス大きく分けて”FuncAnimation”と”ArtistAnimation”があります。
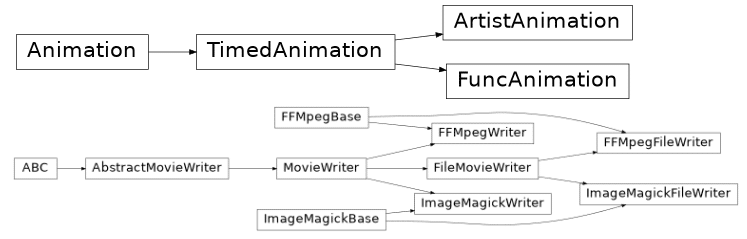
【Animationクラス】
●FuncAnimation:"function func"を連続で呼び出すことでAnimationを作成
ー>毎回関数を変更して表示(リストで保持しないためメモリ小)
ー>ループするため動画などに出力する場合は時間指定(frame)が必要
●ArtistAnimation:"fixed set of Artist objects"を使用したAnimation
ー>グラフデータをリストで保持して1枚ずつ表示(メモリ大)
2-2.ArtistAnimation
ArtistAnimationは直感的に使用できます。作成したfigureを一度リストに入れて、そのリストをArtistAnimationで処理します。
【Animationの引数】
●interval:動画のフレーム速度[ms] (※fps=1000÷interval)
[IN]
import numpy as np
import matplotlib.pyplot as plt
import matplotlib.animation as animation

fig = plt.figure(figsize=(6,6))
imgs = [] #各フレームの図を保存するためのリスト

for i in range(100):
    array = np.linspace(0, i, 10) #0~iを10個に分割
    x = np.arange(10) #array([0, 1, 2, 3, 4, 5, 6, 7, 8, 9])
    im = plt.plot(x, array)
    imgs.append(im) #imgsに各フレームの図を追加

ani = animation.ArtistAnimation(fig, imgs, interval=100)
plt.show()
ani.save('Animation_線形.gif', writer='pillow')

[OUT]
2-3.FuncAnimation
FuncAnimationは癖を理解する必要があります。プロセスとしては先に関数を作成して、その関数をFuncAnimation(fig, <処理する関数>)で連続的に処理させます。引数および注意点を下記に記載しました。
【FuncAnimationの注意点】
●FuncAnimation実行時に関数がループ処理されるため、関数にはループ用の引数を渡す必要がある
●plt.cla()で前のフレームをクリアしない場合は各フレームの図が重なって表示される
●ループ計算するため各処理でリストにデータを追加して表示させていけば動きがつながっているような図も作成可能である。
●各フレームで処理を削除するため装飾(ラベル、軸名、グリッドなど)は関数内に入れて毎回処理をさせる必要がある
【Animationの引数】
●interval:動画のフレーム速度[ms] (※fps=1000÷interval)
●frame:動画のフレーム数
ー>ループの回数と同じ
ー>リストを渡すとリスト内データがループする
●fargs:ループ用以外に引数がある関数を作成した場合、FuncAnimationの関数内に直接引数は渡せない。fargs=<配列(ListやTuple)>で値を渡すことで別の引数も使用することができる
コードを何パターンか記載することで動きを確認しました。
[IN]
import numpy as np
import matplotlib.pyplot as plt
import matplotlib.animation as animation

fig = plt.figure(figsize=(6,6))
plt.grid()

def linearplot(frame_No):
    array = np.linspace(0, frame_No, 10) #0~iを10個に分割
    x = np.arange(10) #array([0, 1, 2, 3, 4, 5, 6, 7, 8, 9])
    im = plt.plot(x, array)

ani = animation.FuncAnimation(fig, linearplot, interval=100, frames=50) #
from IPython.display import HTML
HTML(ani.to_html5_video())

[OUT]
plt.cla()がないため図が重なる
frames=50のため線の傾き(np.linspace)はMAX50
[IN]
import numpy as np
import matplotlib.pyplot as plt
import matplotlib.animation as animation
fig = plt.figure(figsize=(6,6))
plt.grid()
def linearplot(frame_No):
plt.cla()
array = np.linspace(0, frame_No, 10) #0~iを10個に分割
x = np.arange(10) #array([0, 1, 2, 3, 4, 5, 6, 7, 8, 9])
im = plt.plot(x, array)
ani = animation.FuncAnimation(fig, linearplot, interval=500, frames=10) #
from IPython.display import HTML
HTML(ani.to_html5_video())
[OUT]
plt.cla()があるため毎回新規でフレームが作成される
frames=10のため線の傾き(np.linspace)はMAX10
plt.grid()は関数の外にあるため、関数が繰り返されるタイミングでクリアになるため表示されない
[IN]
import numpy as np
import matplotlib.pyplot as plt
import matplotlib.animation as animation
import japanize_matplotlib

fig = plt.figure(figsize=(6,6))

def linearplot(frame_No):
    plt.cla()
    array = np.linspace(0, frame_No, 10) #0~iを10個に分割
    x = np.arange(10) #array([0, 1, 2, 3, 4, 5, 6, 7, 8, 9])
    im = plt.plot(x, array)
    plt.grid()
    plt.xlabel('x軸'); plt.ylabel('y軸')
    plt.title(f'フレームNo:{frame_No}', y=-0.15)

ani = animation.FuncAnimation(fig, linearplot, interval=500, frames=[1,10,100,50,25])
from IPython.display import HTML
HTML(ani.to_html5_video())

[OUT]
framesにリストを入れており、リスト内のデータがループしている
関数内で図を装飾した場合は各フレームにデータが残る
3.Animationの出力
Jupyterを使用した場合に"plt.show()"や"%matplotlib inline"でAnimationが表示されないことがあります。その対処法を紹介します。
3ー1.JavaScript化:HTML(ani.to_jshtml())
対処法としてアニメーションをJavaScript化します。
[IN]
from IPython.display import HTML
HTML(ani.to_jshtml())
具体的な使用例は下記の通りです。出力後はボタン付きの画面が現れるため再生ボタン(▶)を押すとアニメーションが動きます。
[IN]
import numpy as np
import matplotlib.pyplot as plt
import matplotlib.animation as animation

fig = plt.figure(figsize=(6,6))
anims = [] #各フレームの図を保存するためのリスト

for i in range(100):
    array = np.linspace(0, i, 10) #0~iを10個に分割
    x = np.arange(10) #array([0, 1, 2, 3, 4, 5, 6, 7, 8, 9])
    im = plt.plot(x, array)
    anims.append(im) #animsに各フレームの図を追加

ani = animation.ArtistAnimation(fig, anims, interval=100)

from IPython.display import HTML
HTML(ani.to_jshtml())

[OUT]
3ー2.mp4化:HTML(ani.to_html5_video())
対処法としてアニメーションをHTML5 video化します。
[IN]
from IPython.display import HTML
HTML(ani.to_html5_video())
具体的な使用例は下記の通りです。
[IN]
import numpy as np
import matplotlib.pyplot as plt
import matplotlib.animation as animation

fig = plt.figure(figsize=(6,6))
anims = [] #各フレームの図を保存するためのリスト

for i in range(100):
    array = np.linspace(0, i, 10) #0~iを10個に分割
    x = np.arange(10) #array([0, 1, 2, 3, 4, 5, 6, 7, 8, 9])
    im = plt.plot(x, array)
    anims.append(im) #animsに各フレームの図を追加

ani = animation.ArtistAnimation(fig, anims, interval=100)

from IPython.display import HTML
HTML(ani.to_html5_video())

[OUT]
【参考:Windowsでのエラー対応】
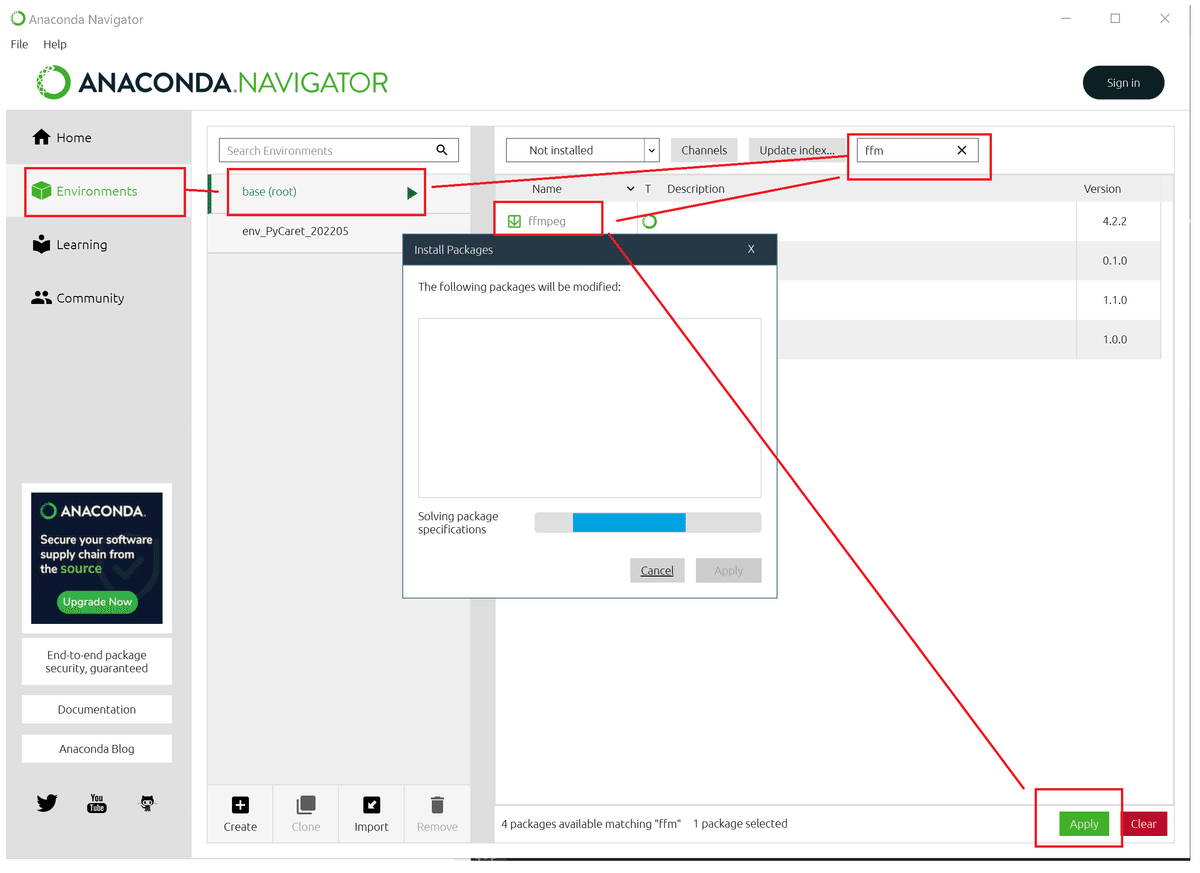
なお上記はGoogle Colab上から実行しており、自宅PCのWindowsから実行したら"ffmpegがない"とのエラーがでました。Windowsではffmpegを
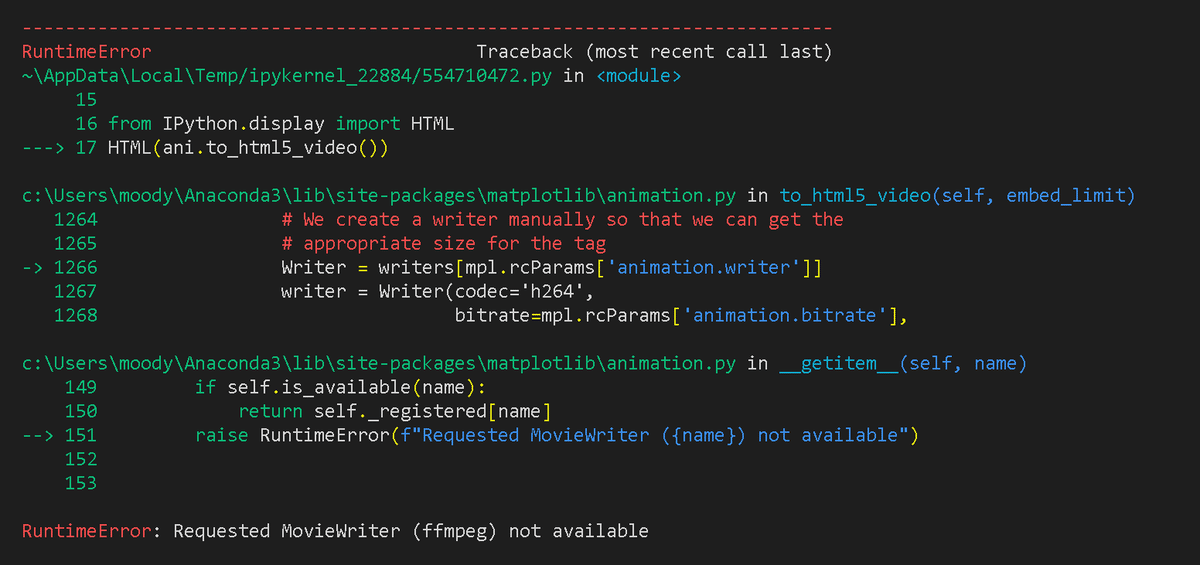
現在の環境はANACONDAを使用しているため環境設定でffmpegを追加しました。エラーは出なくなったけど動画が動かなかったので諦めました。
(解決したら追記予定)
4.Animationの保存
保存はインスタンス化したアニメーションのsaveメソッドを使用します。保存形式によって記法が異なるため注意が必要です。
[saveメソッド]
ani.save(<保存するファイル名>, writer=<形式>)
4ー1.Gif化
Gifを保存する場合は拡張子をgifにして形式を"pillow"を選択します。
[IN]
~省略~
ani = animation.ArtistAnimation(fig, imgs, interval=100)
ani.save('Animation_線形.gif', writer='pillow')

[OUT]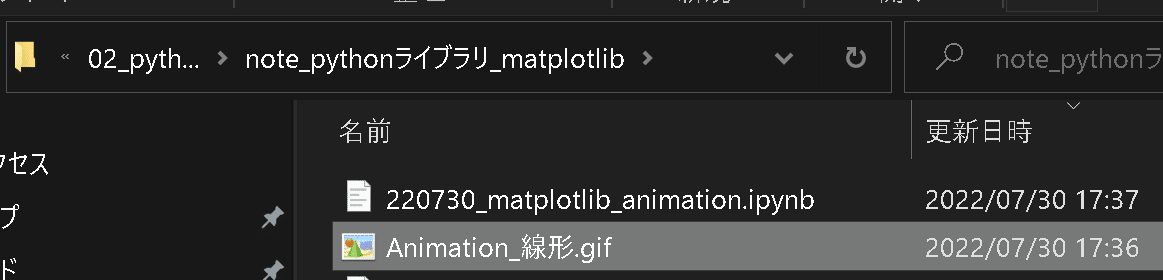
4ー2.mp4化
動画形式で保存する場合は拡張子を"mp4"で実行すれば問題なくファイル生成できました(※ffmpegはANACONDAで設定済み)。
(FuncAnimationではframe数に注意すること)
[IN]
ani.save('animation.mp4')
5.Animation応用:基礎編
5-1.画像を表示するアニメーション
下記記事の「Pillowでやってみたシリーズ2:画像の結合」で使用した画像を利用してGifを作成してみました。
前の応用として①globで画像パスを取得してリスト化、②画像を表示する関数を作成、③FuncAnimationを使用してframesに①のリストを渡す ことでgif画像を作成しました。
[IN]
import glob
path = r"C:\Users\KIYO\Desktop\note\02_pythonライブラリ\note_pythonライブラリ_Pillow\sampleimages" #画像ファイルがあるディレクトリ
path_files = glob.glob(path + "/*.jpg")

import numpy as np
import matplotlib.pyplot as plt
import matplotlib.animation as animation

fig = plt.figure(figsize=(6,6))

def showpictures(path_file):
    plt.cla()
    img = plt.imread(path_file) #画像を読み込む
    plt.imshow(img) #画像を表示
    plt.axis('off') #axisを消す

ani = animation.FuncAnimation(fig, showpictures, interval=500, frames=path_files)
ani.save('animation_girls.gif', writer='pillow')

[OUT]
6.Animation応用:実践編
6-1.1次元熱伝導の非定常計算
下記記事にまとめましたので興味があればご確認ください。
参考記事
あとがき
取り急ぎ先だし
この記事が気に入ったらサポートをしてみませんか?