Pythonライブラリ(可視化):Graphviz

1.概要
GraphvizはMatplotlibやSeabornのようなデータのグラフ化より、決定木の見える化やプロセスフローの可視化に使用されます。
記載方法は①通常記法、②raw DOT記法で記載の2種類があります。
参考までに近いことはDaskでもできそうですが、こちらは追って勉強予定です。
2.環境構築
pip installとは別に環境構築が必要です。一応自分の記事の4章に記載はしていますが参考までに別記事リンクもつけました。
pip install graphviz3.通常記法:DOT記法
GraphVizはDOT記法と呼ばれる記法で記載する必要があります。
GraphvizではDOT記法を記載しなくても図が作成することができます。通常の記法手順は下記の通りです。
●グラフオブジェクトの作成
●ノードやエッジの追加
●グラフの表示・保存
本章は基本的に公式ドキュメントに従って説明します。
3-1.グラフオブジェクトの作成:Digraph()
まず初めにグラフ作成のための土台を作成します。このdotの上に記載するパーツを追加していきます。
[In]
from graphviz import Digraph

dot = Digraph('round-table', comment='The Round Table')
dot

[Out]
※今は何も表示されない
引数としてはformatもありrender時の出力を指定できます。formatは"pdf", "png", "svg"などがあります。formatはdot.formatでも変更できます。
[In]
from graphviz import Digraph

dot = Digraph('round-table', comment='The Round Table', format='png')
下記のように途中でもformatを指定すれば出力を変更できます。
[In]
from graphviz import Digraph

dot = Digraph('round-table', comment='The Round Table')
dot.format = 'png' #描画フォーマットをpngに設定
dot

[Out]
Png形式で出力
【参考】graphviz.Graph()
DigraphではないオブジェクトとしてGraph()があります。Graphは「undirected graphsを作成」と書いておりよくわからんので紹介まで
[In]
import graphviz
g = graphviz.Graph(format='png')
3-2.ノード・矢印の追加:node()、edge()
個別の要素を追加したい場合はnode('node名', 'ラベル名')を使用します。
[In]
from graphviz import Digraph

dot = Digraph('round-table', comment='The Round Table')
dot.node('A', 'King Arthur')
dot.node('B', 'Sir Bedevere the Wise')
dot.node('L', 'Sir Lancelot the Brave')
dot
ノード同士をつなぐ場合はedge('接続元', '接続先')またはedges([接続ノードリスト])を使用します。
[In]
from graphviz import Digraph

dot = Digraph('round-table', comment='The Round Table')
dot.node('A', 'King Arthur')
dot.node('B', 'Sir Bedevere the Wise')
dot.node('L', 'Sir Lancelot the Brave')

dot.edges(['AB', 'AL']) #ABとALをエッジに追加
dot.edge('B', 'L', constraint='false') #constaint=falseで順位差がでない=並列に記載可能
dot

[Out]
左図:dot.edges(['AB', 'AL'])のみ、右図:全コード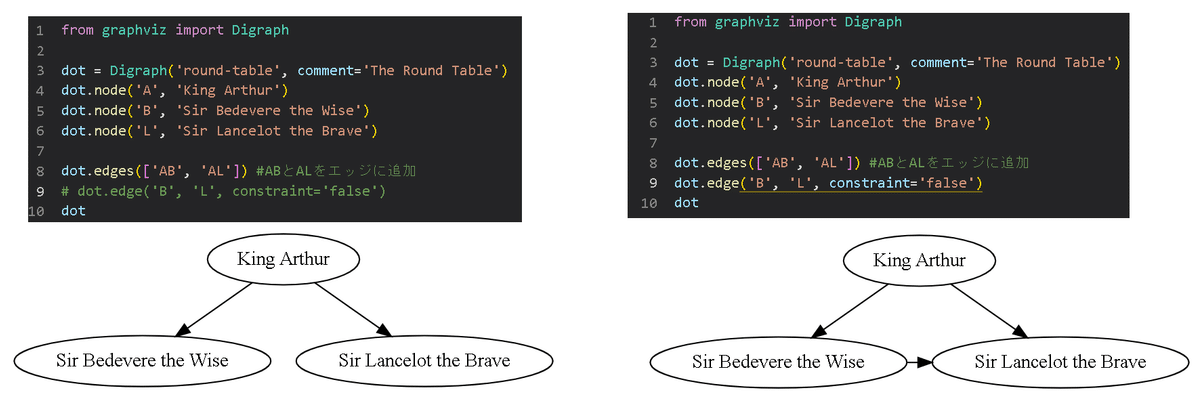
3-3.DOT記法の確認:dot.source()
nodeやedgeを追加するとグラフオブジェクト側にDOT記法が追記されていきます。今のグラフのDOT記法を抽出する場合はdot.source()を使用します。
[In]
print(dot.source)

[Out] ※上の右図のDOT記法
// The Round Table
digraph "round-table" {
	A [label="King Arthur"]
	B [label="Sir Bedevere the Wise"]
	L [label="Sir Lancelot the Brave"]
	A -> B
	A -> L
	B -> L [constraint=false]
}
3-4.グラフの確認・保存:dot.render()/dot.view()
作成したグラフを出力したい場合はdot.render()になります。
●グラフオブジェクトでformatを指定していない場合PDF形式で出力
●directory引数に文字列を入れるとフォルダが作成されます
[In]
from graphviz import Digraph

dot = Digraph('round-table', comment='The Round Table') #デフォルトのformatはpdf
dot.node('A', 'King Arthur')
dot.node('B', 'Sir Bedevere the Wise')
dot.node('L', 'Sir Lancelot the Brave')

dot.edges(['AB', 'AL']) #ABとALをエッジに追加
dot.edge('B', 'L', constraint='false') #constaint=falseで順位差がでない=並列に記載可能

dot.render(directory='doctest-output', view=True) #view=Trueでファイルが表示される
render()ではなくdot.view()でもグラフは確認できます。
3-5.グラフのスタイル変更:dot.attr
dot.attr(attrは下記参照)でグラフの向きや矢印の形状を変更可能です。変更方法は2通りあります。
【スタイル更新の記法】
●dot.attr['属性'] = '値':個別の値を修正
●dot.attr.update('属性1'='値1', '属性2'='値2'):まとめて更新可能
3-5-1.グラフの向き:dot.graph_attr['rankdir']
rankdir属性を指定することでグラフの向きを変更できます。
[In] dot, node, edgeは同上
dot.graph_attr['rankdir'] = 'LR'
dot

[Out]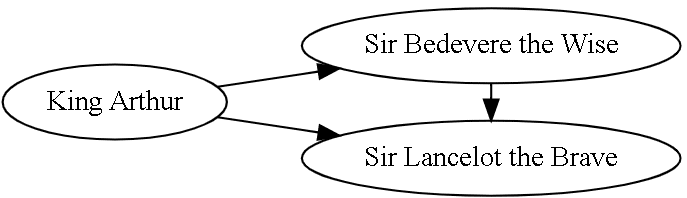
3-5-2.矢印スタイルの変更:dot.edge_attr
dot.edge_attr内の属性を設定することで矢印のスタイル変更できます。
[In]
dot.graph_attr['rankdir'] = 'LR'
dot.edge_attr.update(arrowhead='vee', arrowsize='2')
dot

[Out]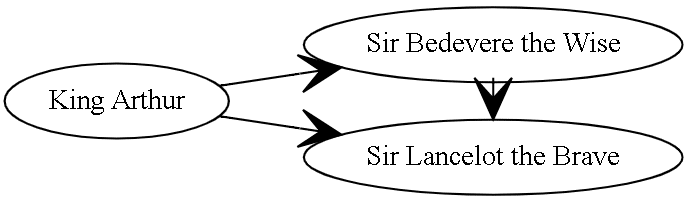
3-5-3.ノードスタイルの変更(全体):dot.node_attr
dot.node_attr内の属性を設定することでノードのスタイル変更できます。
[In]
dot.node_attr.update(shape='box', style='filled', color='red',
                    fontname='MS Gothic', fontsize='10',fontcolor='blue',
                    fillcolor='lightblue', height='1.2', width='1.2')
dot

[Out]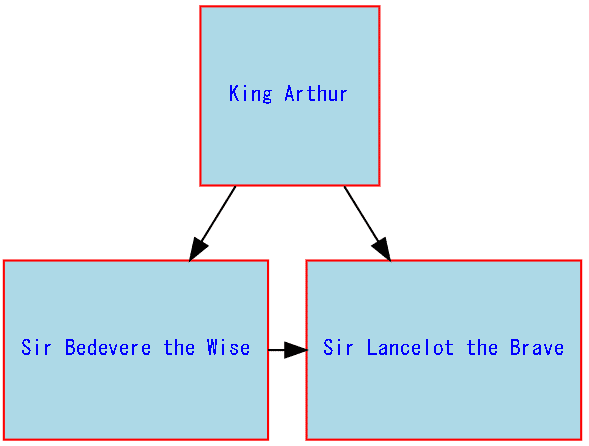
4.GraphVizの記法:raw DOT記法
前章においてdot.source()でDOT記法を見ました。あのDOT記法を直接記載してグラフを出力できるのがraw DOT記法になります。関数化することが出来ればraw DOTの方が柔軟性は高いと思います。
4-1.記載法:graphviz.Source('digraph {DOT記法}')
raw DOT記法はSourceメソッドを使用します。
[In]
import graphviz

dot1 = graphviz.Source('digraph { x -> y }')
display(dot1)

dot2 = graphviz.Source('digraph "the holy hand grenade" { rankdir=LR; 1 -> 2 -> 3 -> lob }')
display(dot2)

[Out]
左図:dot1、右図:dot2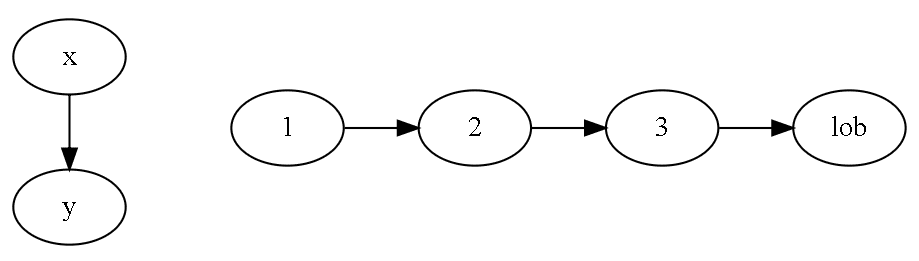
参考までに3-3節で出力したdot.source()を直接記載して同じ出力が得られること確認します。下記以降は直接記載ではなくf-stringsを使用します。
[In]
dot3 = graphviz.Source(''' // The Round Table
digraph {
	A [label="King Arthur"]
	B [label="Sir Bedevere the Wise"]
	L [label="Sir Lancelot the Brave"]
	A -> B
	A -> L
	B -> L [constraint=false]
}''')

dot3

[Out]
3-3節と同じ出力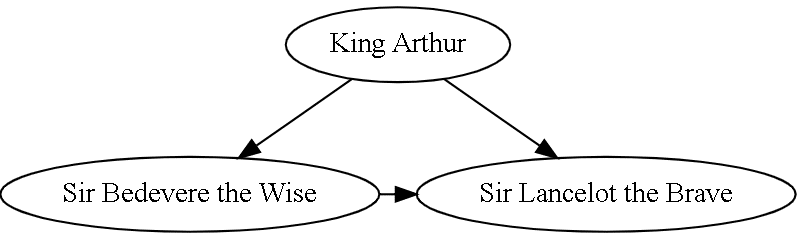
4-2.ノード・矢印の追加
個別の要素を追加したい場合はdigraph{後に 'node名' [label= 'ラベル名']を箇条書きします。
[In]
import graphviz

dottext = '''digraph {

	A [label="King Arthur"]
	B [label="Sir Bedevere the Wise"]
	L [label="Sir Lancelot the Brave"]

}'''

dot = graphviz.Source(f'{dottext}')
dot

[Out]
ノード同士をつなぐ場合は ノード名(接続元) -> ノード名(接続先) を箇条書きします。
[In]
import graphviz

dottext = '''digraph {

	A [label="King Arthur"]
	B [label="Sir Bedevere the Wise"]
	L [label="Sir Lancelot the Brave"]
	A -> B
	A -> L
	B -> L [constraint=false]
}'''

dot = graphviz.Source(f'{dottext}')
dot

[Out]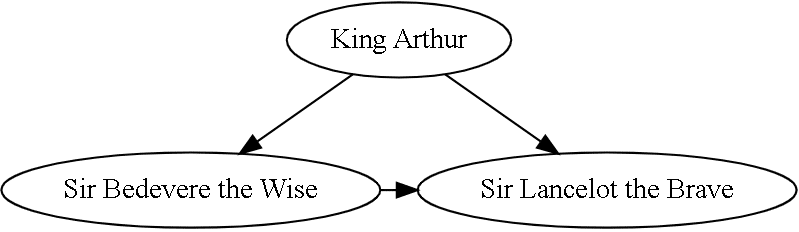
4-3.DOT記法の確認:print(dot)
現在のDOT記法を確認するにはgraphviz,Sourceでインスタンス化したオブジェクトをprint()で表示することで確認できます。関数で作成したDOT記法が間違っていないかを確認する時に便利です。
[In]
print(dot)

[Out]
digraph {

	A [label="King Arthur"]
	B [label="Sir Bedevere the Wise"]
	L [label="Sir Lancelot the Brave"]
	A -> B
	A -> L
	B -> L [constraint=false]
}
4-4.グラフの確認・保存:dot.render()
グラフの保存は3章と同じdot.render()で処理可能です。
[In]
import graphviz

dottext = '''digraph {

	A [label="King Arthur"]
	B [label="Sir Bedevere the Wise"]
	L [label="Sir Lancelot the Brave"]
	A -> B
	A -> L
	B -> L [constraint=false]
}'''

dot = graphviz.Source(f'{dottext}')
dot.render(directory='note_rawdot', view=True) #view=Trueでファイルが表示される

[Out]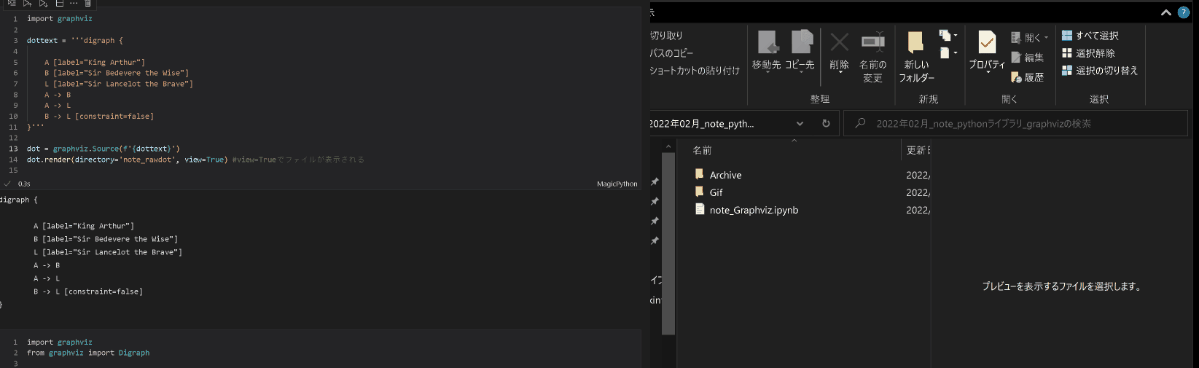
4-5.グラフのスタイル変更
基本的な記法は3-5節と同じですがDOT記法として覚える必要があります。
4-5-1.グラフの向き:graph [rankdir=値]
グラフの向きを指定する場合はgraph [rankdir=値]と記載します。
[In]
import graphviz

dottext = '''digraph {
    graph [rankdir=LR]
	A [label="King Arthur"]
	B [label="Sir Bedevere the Wise"]
	L [label="Sir Lancelot the Brave"]
	A -> B
	A -> L
	B -> L [constraint=false]
}'''

dot = graphviz.Source(f'{dottext}')
dot

[Out]
4-5-2.矢印スタイルの変更:edge [属性=値]
矢印のスタイル変更はedgeで指定できます。属性を複数指定する場合はedge ['属性1'='値1' '属性2'='値2']のように列挙で指定できます。
[In]
import graphviz

dottext = '''digraph {
    graph [rankdir=LR]
    edge [arrowhead=vee arrowsize=2]

	A [label="King Arthur"]
	B [label="Sir Bedevere the Wise"]
	L [label="Sir Lancelot the Brave"]
	A -> B
	A -> L
	B -> L [constraint=false]
}'''

dot = graphviz.Source(f'{dottext}')
dot

[Out]
4-5-3.ノードスタイルの変更(全体):node [属性=値]
dot.node_attr内の属性を設定することで矢印のスタイル変更できます。
[In]
import graphviz

dottext = '''digraph {
    node [color=red fillcolor=lightblue fontcolor=blue fontname="MS Gothic" fontsize=10 height=1.2 shape=box style=filled width=1.2]

	A [label="King Arthur"]
	B [label="Sir Bedevere the Wise"]
	L [label="Sir Lancelot the Brave"]
	A -> B
	A -> L
	B -> L [constraint=false]
}'''

dot = graphviz.Source(f'{dottext}')
dot

[Out]
4-6.ノードスタイルの変更(個別)
各ノードのスタイルはノードの属性を列挙します。
[In]
import graphviz

dottext = '''digraph {
	A [label="King Arthur", color=orange, style=filled, shape=star]
	B [label="Sir Bedevere the Wise", color=lightblue, style=filled, shape=circle]
	L [label="Sir Lancelot the Brave", color=lightblue, style=filled, shape=box]
	A -> B
	A -> L
	B -> L [constraint=false]
}'''

dot = graphviz.Source(f'{dottext}')
dot

[Out]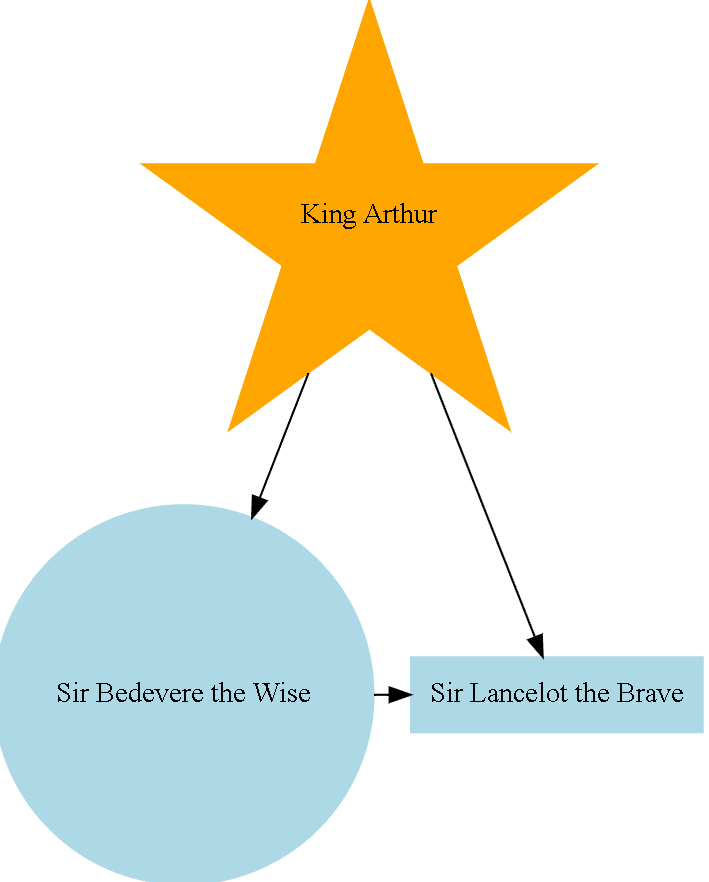
5.Graphvizの注意点
正確にいうとDOT記法の注意点ですが|使えない文字⦅工夫すればいける?⦆があるのでうまくいかない時はテキスト側の見直しが必要です。
[テキストで使用時に注意すべき文字]
    text = text.replace('(', '(')
    text = text.replace(')', ')')
    text = text.replace(' ', '')
    text = text.replace('.', '_')

    text = text.replace(' ', '') #半角スペース
    text = text.replace(' ', '') #全角スペース
    text = text.replace('.', '') #コンマ
    text = text.replace('(', '(') #半角かっこ
    text = text.replace(')', ')') #半角かっこ
    text = text.replace('-', '-') #ハイフン
    text = text.replace('#', '#') #半角シャープ
    text = text.replace('~', '~')
    text = text.replace('&', '&')
    text = text.replace('!', '!')
6.実演
Graphvizで作成できる図を紹介します。
6-1節ではサンプルで全結合のグラフ作成をしましたが、きれいに書きたい場合は「NN SVG」がお勧めです。
NN-SVG is a tool for creating Neural Network architecture drawings parametrically rather than manually!
— Philip Vollet (@philipvollet) January 25, 2022
It also provides the ability to export those drawings to Scalable Vector Graphics (SVG) files, suitable for inclusion in academic papers or web pageshttps://t.co/eQAqTUT9Sc pic.twitter.com/2N6qZh3iCV
6-1.ニューラルネットワークの図示
ニューラルネットワークの図示をGraphvizで実施しました。
【ポイント】
●入力層・中間層・出力層のノード数・層数を決めるクラスを作る。
●クラス内でDOT記法用のnode、edgesを作成する。
●graphviz.Source()内に上記で作成したDOT記法を入れる。
[In]
import graphviz

#Neual Networkを描画
class NNnode:
	def __init__(self, inputs:int, layers:int, nodes:int, outputs:int):
		self.inputs = inputs
		self.layers = layers
		self.nodes = nodes
		self.outputs = outputs
		self.label_input = 'x' #入力層のラベル
		self.label_node = 'n' #中間層のラベル
		self.label_output = 'y' #出力層のラベル

	@property
	def inputslabels(self):
		self.label_inputs = [self.label_input + str(i+1) for i in range(self.inputs)]
		return self.label_inputs

	@property
	def nodeslabels(self):
		self.label_nodes = [] #中間層のラベル
		for layer in range(self.layers):
			_ = [] #ラベルを格納するリスト
			for node in range(self.nodes):
				_.append(self.label_node + str(layer+1) + str(node+1))
			self.label_nodes.append(_) #中間層のラベルをリストに格納
		return self.label_nodes

	@property
	def outputslabels(self):
		self.label_outputs = [self.label_output + str(i+1) for i in range(self.outputs)]
		return self.label_outputs

	def setnodes(self):
		text_input = ''
		for x in self.inputslabels:
			text_input += f'{x} [color=orange, style=filled, shape=circle]\n'

		text_node = ''
		for node_layers in self.nodeslabels:
			for node in node_layers:
				text_node += f'{node} [shape=circle]\n'

		text_output = ''
		for output in self.outputslabels:
			text_output += f'{output} [color=lightblue, style=filled, shape=circle]\n'

		output = text_input + text_node + text_output
		return output

	def setedges(self):
		#入力層から中間層へのエッジ
		self.edges_inputs = ''
		nodes_1st = self.nodeslabels[0] #中間層の1番目のノード
		for x in self.inputslabels:
			for n in nodes_1st:
				self.edges_inputs += f'{x} -> {n}\n'

		#中間層から中間層へのエッジ
		self.edges_nodes = ''
		for idx in range(len(self.inputslabels)):
			for node in self.label_nodes[idx]:
				for nextnode in self.label_nodes[idx+1]:
					self.edges_nodes += f'{node} -> {nextnode}\n'

		#中間層から出力層へのエッジ
		self.edges_outputs = ''
		nodes_last = self.nodeslabels[-1] #中間層の最後のノード
		for node in nodes_last:
			for output in self.label_outputs:
				self.edges_outputs += f'{node} -> {output}\n'

		return self.edges_inputs + self.edges_nodes + self.edges_outputs

#Neural Networkを描画:DOT記法
nnnode = NNnode(inputs=2, layers=3, nodes=3, outputs=2)
nodes = nnnode.setnodes()
edges = nnnode.setedges()

dottext = f'''digraph {{
	node[fontname="MS Gothic"] rankdir=LR
	{nodes}
	{edges}
}}'''

dot = graphviz.Source(f'{dottext}')
dot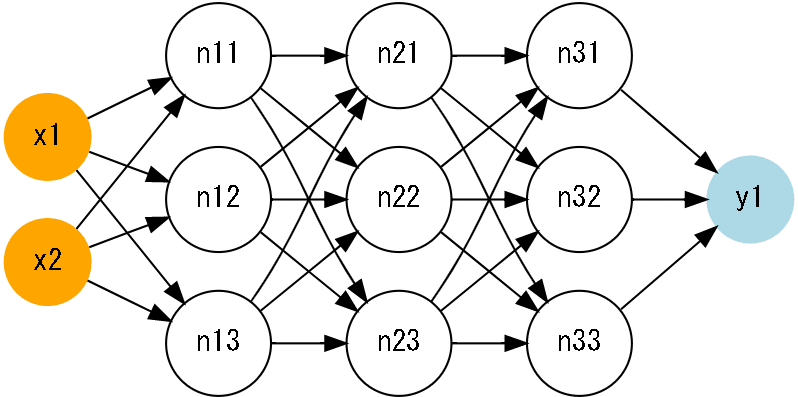
6-2.指定パス内のフォルダの可視化
私が作成しているnote記事フォルダ内でrootパスから一つ下のまでのフォルダをすべて抽出してどのようなフォルダを作成しているか可視化しました。
【ポイント】
●os.walk()で自分が見たい|階層⦅深さ⦆までのフォルダを抽出する。
●クラス内でDOT記法用のnode、edgesを作成する。
●graphviz.Source()内に上記で作成したDOT記法を入れる。
●下記エラーが出ないように名前にクレンジングをかける。
(UnicodeDecodeError: 'utf-8' codec can't decode byte 0xe5 in position 261: invalid continuation byte)
[In]
import os
import graphviz
from typing import List

def wordclean(text):
    text = text.replace('(', '(')
    text = text.replace(')', ')')
    text = text.replace(' ', '')
    text = text.replace('.', '_')

    text = text.replace(' ', '') #半角スペース
    text = text.replace(' ', '') #全角スペース
    text = text.replace('.', '') #コンマ
    text = text.replace(':', '') #コロン
    text = text.replace('(', '') #半角かっこ
    text = text.replace(')', '') #半角かっこ
    text = text.replace(')', '') #半角かっこ
    text = text.replace('(', '') #半角かっこ
    text = text.replace('-', '-') #ハイフン
    text = text.replace('#', '#') #半角シャープ
    text = text.replace('~', '~')
    text = text.replace('&', '&')
    text = text.replace('!', '!')

    text = [i.replace('0', '0') if os.path.basename(i)[0]==str(0) else i for i in [text]][0]
    text = [i.replace('1', '1') if os.path.basename(i)[0]==str(1) else i for i in [text]][0]
    text = [i.replace('2', '2') if os.path.basename(i)[0]==str(2) else i for i in [text]][0]
    text = [i.replace('3', '3') if os.path.basename(i)[0]==str(3) else i for i in [text]][0]
    text = [i.replace('4', '4') if os.path.basename(i)[0]==str(4) else i for i in [text]][0]
    text = [i.replace('5', '5') if os.path.basename(i)[0]==str(5) else i for i in [text]][0]
    text = [i.replace('6', '6') if os.path.basename(i)[0]==str(6) else i for i in [text]][0]
    text = [i.replace('7', '7') if os.path.basename(i)[0]==str(7) else i for i in [text]][0]
    text = [i.replace('8', '8') if os.path.basename(i)[0]==str(8) else i for i in [text]][0]
    text = [i.replace('9', '9') if os.path.basename(i)[0]==str(9) else i for i in [text]][0]

    return text

#一階層下のフォルダを取得
def get_dirname():
    output = []
    for idx, (root, dirs, files) in enumerate(os.walk('./')):
        if idx == 0: #作業ディレクトリのパスを取得
            path_rootdirs = [os.path.abspath(dir) for dir in dirs] #指定パス内のディレクトリの絶対パス取得
            rootdirs = dirs #指定パス内のディレクトリ名取得

        for path_rootdir, rootdir in zip(path_rootdirs, rootdirs):
            if os.path.abspath(root) == path_rootdir:
                output.append((rootdir, dirs))

    return output


dirs = get_dirname()

class Dirview:
    def __init__(self, dirs: List):
        self.dirs = dirs

    def setnodes(self):
        text_nodes = ''
        for dir in self.dirs:
            text_nodes += f'{wordclean(dir[0])} [color=orange, style=filled, shape=box]\n'
            for subdir in dir[1]:
                text_nodes += f'{wordclean(subdir)} [color=lightblue, style=filled, shape=box]\n'
        return text_nodes

    def setedges(self):
        self.edges = ''
        for dir in self.dirs:
            for subdir in dir[1]:
                self.edges += f'{wordclean(dir[0])} -> {wordclean(subdir)}\n'
        return self.edges

dirs = get_dirname()

#Neural Networkを描画:DOT記法
dirs_note = Dirview(dirs=dirs[:2])
nodes = dirs_note.setnodes()
edges = dirs_note.setedges()

dottext = f'''digraph {{
	node[fontname="MS Gothic"] rankdir=LR
	{nodes}
	{edges}
}}'''

dot = graphviz.Source(f'{dottext}')
dot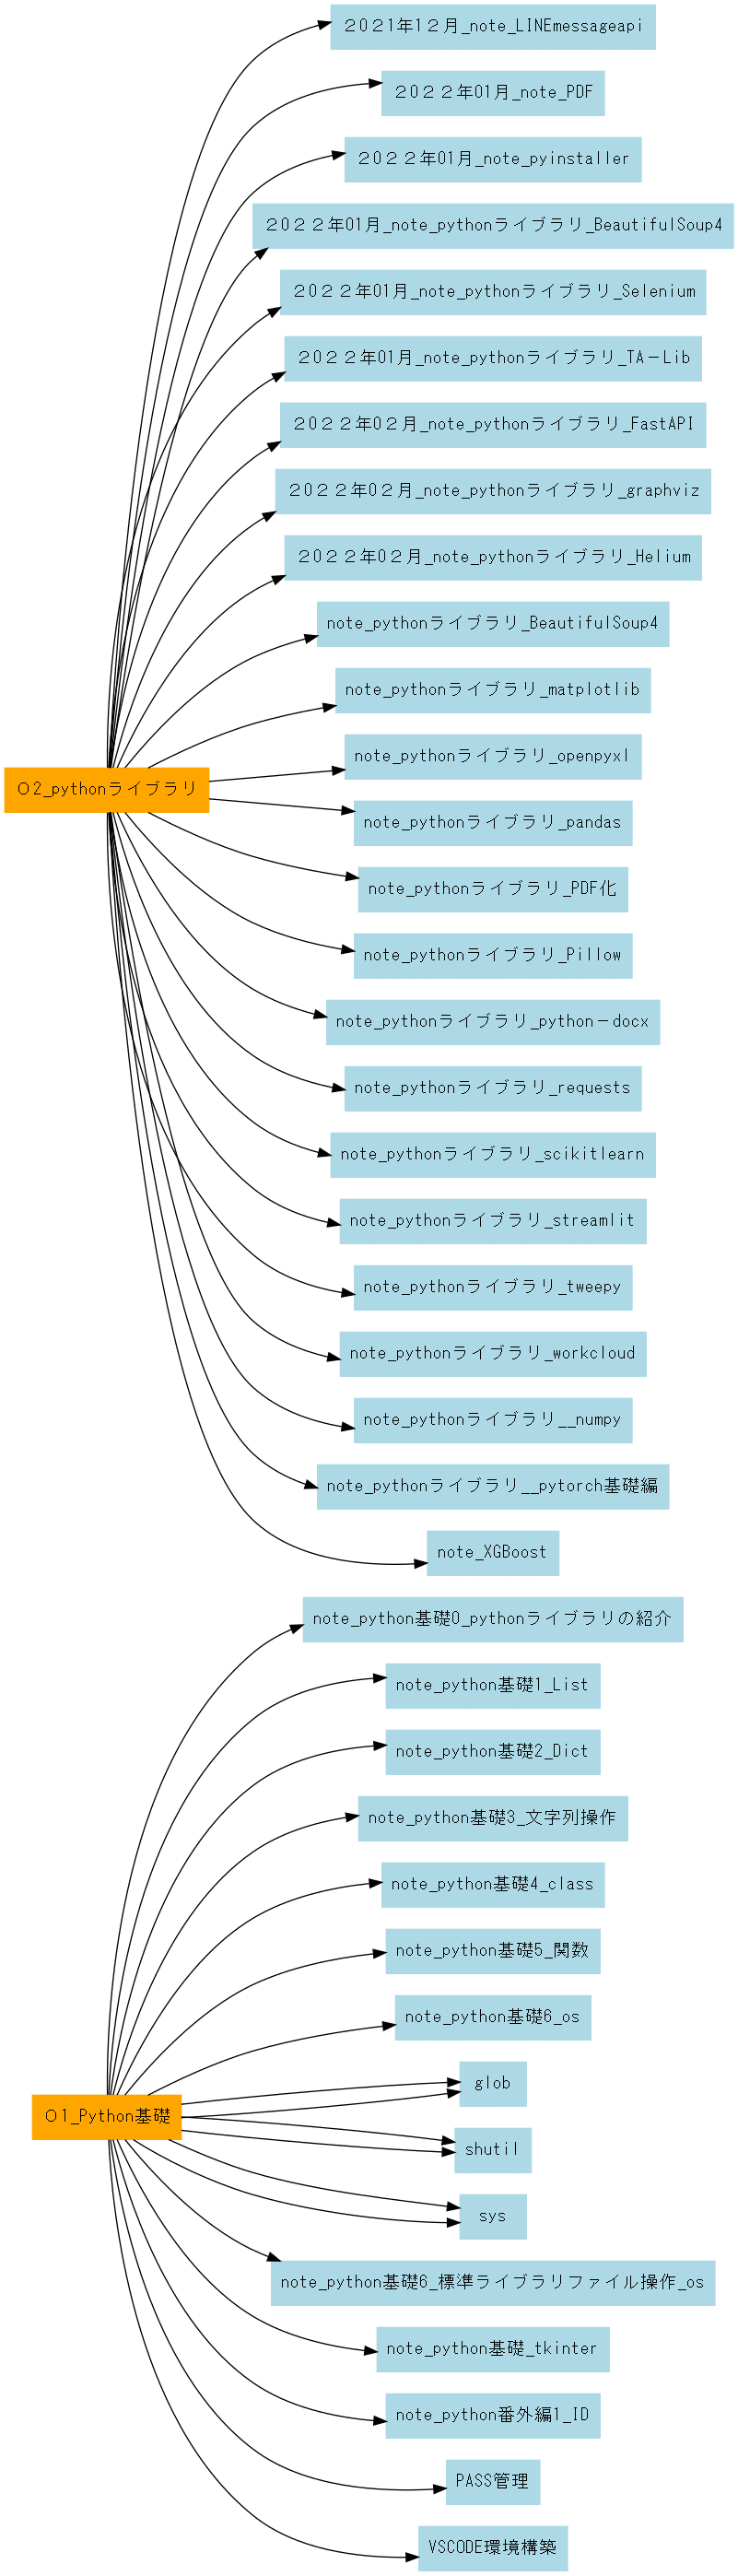
参考
Graphvizのカラー設定の参考
あとがき
5章はばてたので追って追記(決定木の可視化)。
DOT記法をちゃんと理解していないのでUnicodeDecodeErrorの解消法が適当すぎるのでいつか修正せねば・・・・・