Python でモメンタム(Momentum)を算出する

モメンタム(Momentum)とは
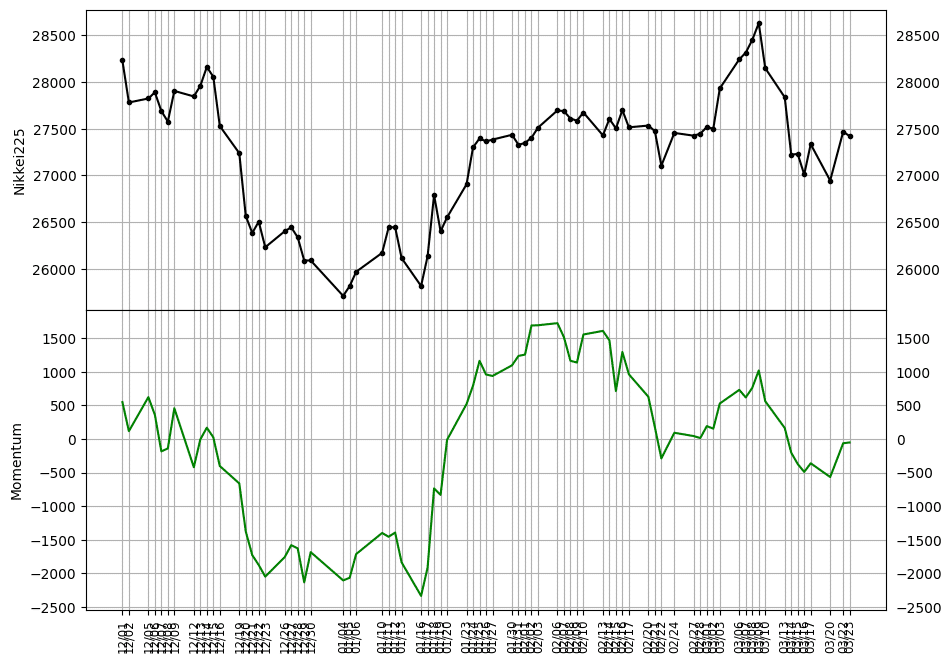
モメンタムは現在の値と指定期間前の値の差です。
現在と過去の値の差から値動きの勢いを把握します。
例えば、次のような活用法があります。
モメンタムが+であれば上昇トレンドと判断
モメンタムが-であれば下落トレンドと判断
売買シグナルに使う場合は、一般的には次のように判断します。
モメンタムが-から+に転じたら買い
モメンタムが+から-に転じたら売り
ソースコードと実行結果
def calcMomentum(**kwargs):
    """モメンタムを算出する

    Args:
        data (pandas.Series): 算出する対象の値
        period (int): 算出する期間

    Returns:
        pandas.Series: モメンタム
    """
    DATA = kwargs['data']
    period = kwargs['period']

    return DATA - DATA.shift(period, axis=0)
出力用のソースコードも記載しておきます。
import matplotlib.pyplot as plt
import matplotlib.dates as mdates

def plotChart(**kwargs):
    OHLCV = kwargs['ohlcv']
    start = kwargs['start']
    end = kwargs['end']
    label = kwargs['label']
    file = kwargs['file']

    fig = plt.figure(figsize=(8, 6))
    ax_Price = fig.add_axes([0, 0.5, 1, 0.5])
    ax_Indicator = fig.add_axes([0, 0.0, 1, 0.5], sharex=ax_Price)

    ax_Price.plot(OHLCV['Close'][start:end], color='black', marker='.')
    ax_Price.tick_params(labelright=True)
    ax_Price.grid(True)
    ax_Price.set_ylabel(label)

    ax_Indicator.plot(calcMomentum(data=OHLCV['Close'], period=20)[start:end], color='green')
    ax_Indicator.tick_params(labelright=True)
    ax_Indicator.grid(True)
    ax_Indicator.set_ylabel('Momentum')

    ax_Indicator.set_xticks(OHLCV[start:end].index)
    ax_Indicator.set_xticklabels(ax_Price.get_xticks(), rotation=90, horizontalalignment='center', fontsize='small')
    ax_Indicator.xaxis.set_major_formatter(mdates.DateFormatter('%m/%d'))

    fig.savefig(file, format='png', bbox_inches='tight')
次のようにplotChart関数を呼び出して実行してください。
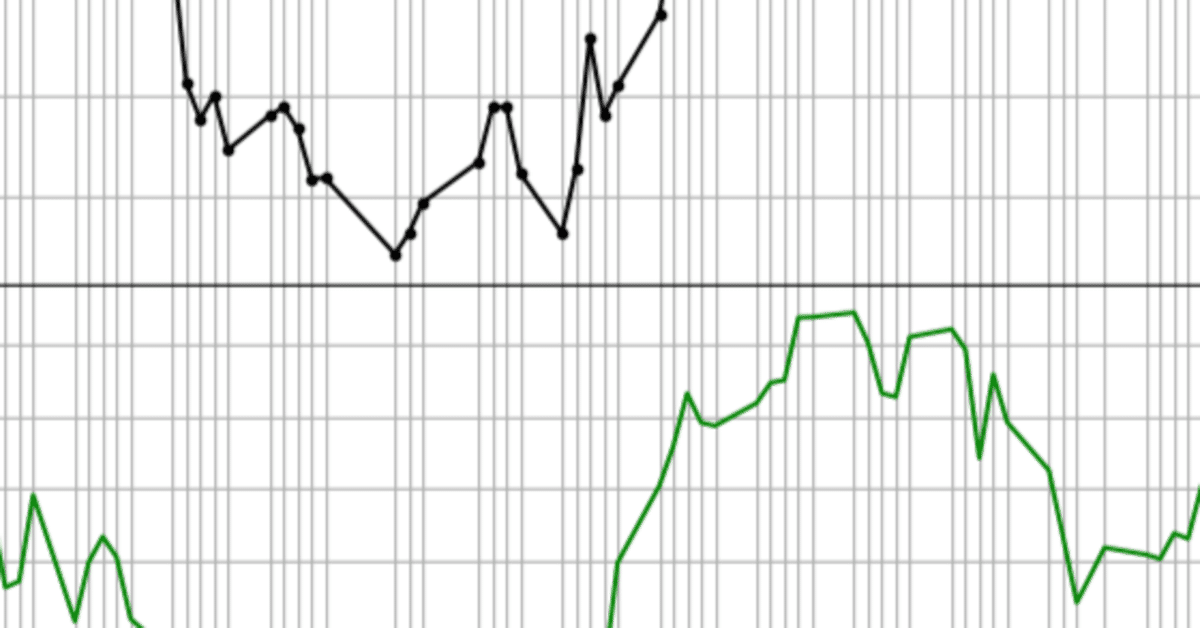
plotChart(ohlcv=OHLCV_N225, start='20221201', end=None, label='Nikkei225', file=filename)すると、次のようなチャートが出力されます。
ソースコードの解説
指定期間前の値を扱うにはshift関数を使用します。
チャートからも分かるように、データにはどうしても外れ値が含まれるため、モメンタムの値は滑らかにはなりません。
そこでデータを平滑化してから差を求めるような場合にも扱えるように、引数をpandas.Seriesで受け取る構造にしています。
参考
pandas.Series.shiftのリファレンス
https://pandas.pydata.org/docs/reference/api/pandas.Series.shift.html
この記事が気に入ったらサポートをしてみませんか?