米株Python [3-6] 自分スクリーニング

こんにちわ!トミィ(@toushi_tommy)です!今回はFinvizでのスクリーニングデータを全部ダウンロードすることで、自分でスクリーニングできるようにカスタマイズしてみます。全銘柄のすべてのデータを取り込むよりも、既にFinvizがまとめているデータを取ることで、時間削減になります。さらにパワフルなスクリーニングを作ってみます。また、マーケットスミスの指標RSを作ってみました。そちらも同時にご確認ください。(注意:スクリーニングを使って、Finvizサイトから全銘柄のデータを取ってきますので、サーバーへ負荷がかかります。できるだけ時間を空けて実行するようにお願いします。また、スクレイピングを禁止している場合もございますので、自己責任にて実行をお願いします。)
サークルは無料で運営しております。記事内容も無料です。トミィにジュースでもおごってあげようと思った方は投げ銭いただけると、今後の運営の励みになります。(セクタ、業界別のランキングスクリーニングのみ有料にしております。)
スクリーニング用データ作成
まずは、Finvizのデータを拾ってきて、データベースを作ります。データーベース作成に5分から10分程かかります。ETF含め、10/9時点で8325銘柄のデータを作成します。下記のコードを実行してください。
# データベース作成
module_dir = '/content/drive/MyDrive/module'
data_dir = '/content/drive/MyDrive/input/'
import os
import sys
sys.path.append(module_dir)
import pandas as pd
from bs4 import BeautifulSoup
import re
import requests
import time
import numpy as np
from datetime import datetime as dt
start = time.time()
base_url = 'https://finviz.com/screener.ashx?v=152&c='+str(list(range(71))).replace(' ','').replace('[','').replace(']','')
df = pd.DataFrame()
cnt = 1
while 1:
url = base_url+'&r='+str(cnt)
time.sleep(0.1)
site = requests.get(url, headers={'User-Agent': 'Custom'}, timeout=3.5)
data = BeautifulSoup(site.text,'html.parser')
da = data.find_all("tr", align="center")
#tables = re.findall('<td class="table-top.*</td>', str(da[0]))
#names = [re.sub('.*>(.+)</td>.*', r'\1', s) for s in tables]
names = ['No.', 'Ticker', 'Company', 'Sector', 'Industry', 'Country', 'Market Cap', 'P/E', 'Fwd P/E', 'PEG', 'P/S', 'P/B', 'P/C', 'P/FCF', 'Dividend', 'Payout Ratio', 'EPS', 'EPS this Y', 'EPS next Y', 'EPS past 5Y', 'EPS next 5Y', 'Sales past 5Y', 'EPS Q/Q', 'Sales Q/Q', 'Outstanding', 'Float', 'Insider Own', 'Insider Trans', 'Inst Own', 'Inst Trans', 'Float Short', 'Short Ratio', 'ROA', 'ROE', 'ROI', 'Curr R', 'Quick R', 'LTDebt/Eq', 'Debt/Eq', 'Gross M', 'Oper M', 'Profit M', 'Perf Week', 'Perf Month', 'Perf Quart', 'Perf Half', 'Perf Year', 'Perf YTD', 'Beta', 'ATR', 'Volatility W', 'Volatility M', 'SMA20', 'SMA50', 'SMA200', '50D High', '50D Low', '52W High', '52W Low', 'RSI', 'from Open', 'Gap', 'Recom', 'Avg Volume', 'Rel Volume', 'Price', 'Change', 'Volume', 'Earnings', 'Target Price', 'IPO Date']
cntns = re.findall('<a class="screener-link.*</a>', str(da[0]))
contents = [[re.sub('<a .*">(.+)</a>.*', r'\1', s).replace('</span>','').replace('&','&') for s in re.findall('<a .*?</a>', i)] for i in cntns]
df1 = pd.DataFrame(contents, columns = names)
print("\r now reading -->> " +df1['Ticker'][0]+'('+str(cnt)+") ---" ,end="")
df = pd.concat([df, df1], axis=0)
if(len(df1)!=20): break
cnt+=20
df = df.replace('-', np.nan)
conv_nums = ['Market Cap','Outstanding','Float','Avg Volume']
conv_float = ['P/E','Fwd P/E','PEG','P/S','P/B','P/C','P/FCF','EPS','Short Ratio','Curr R','Quick R','LTDebt/Eq',
'Debt/Eq','Beta','ATR','RSI','Recom','Rel Volume','Price','Target Price']
conv_pct = ['Dividend','Payout Ratio','EPS this Y','EPS next Y','EPS past 5Y','EPS next 5Y','Sales past 5Y','EPS Q/Q','Sales Q/Q',
'Insider Own','Inst Own','Inst Trans','Float Short','ROA','ROE','ROI','Gross M','Oper M','Profit M',
'Perf Week','Perf Month','Perf Quart','Perf Half','Perf Year','Perf YTD',
'Volatility W','Volatility M','SMA20','SMA50','SMA200','50D High','50D Low','52W High','52W Low',
'from Open','Gap','Change']
conv_date = ['IPO Date']
for c in df.columns.to_list():
if (c in conv_nums):
df[c] = [float(str(s).translate(str.maketrans({'K':'E3','M':'E6','B':'E9','T':'E12'}))) for s in df[c]]
elif (c in conv_float):
df[c] = [float(s) for s in df[c]]
elif (c in conv_pct):
df[c] = [float(str(s).replace('%',''))/100 for s in df[c]]
elif (c in conv_date):
df[c] = [dt.strptime(str(s), '%m/%d/%Y') if re.match(r'\d+/\d+/\d+', str(s)) else s for s in df[c]]
df['PrevClose'] = df['Price'] / (1+df['Change'])
df = df.set_index('Ticker')
#############################################################################
def set_param(df_i, name_ta, param_ta, cat_name=''):
if(cat_name!=''):
df_i[cat_name] = ''
for i in range(len(param_ta)):
base_url = 'https://finviz.com/screener.ashx?v=521&'+param_ta[i]
df_p = pd.DataFrame()
cnt = 1
print("\r now reading -->> " +name_ta[i]+" ---" ,end="")
while 1:
url = base_url+'&r='+str(cnt)
time.sleep(0.1)
site = requests.get(url, headers={'User-Agent': 'Custom'}, timeout=3.5)
data = BeautifulSoup(site.text,'html.parser')
da = data.find_all("td", align="center")
tmp1 = [str(s) for s in da if 'cssbody=[tabchrtbdy]' in str(s)]
tmp2 = [[s for s in re.findall('<td title=.*?</small></td>', s)] for s in tmp1]
flat = [x for row in tmp2 for x in row]
tickers = [re.sub('.*">(.+)</a>.*', r'\1', s) for s in flat]
df1 = pd.DataFrame({ "Ticker" : tickers })
if(len(df1)>0):
print("\r now reading -->> " +name_ta[i]+' : ' +df1['Ticker'][0]+'('+str(cnt)+") ---" ,end="")
df_p = pd.concat([df_p, df1], axis=0)
if(len(df1)<500): break
cnt+=500
if(cat_name!=''):
df_i.loc[df_p['Ticker'].to_list(),cat_name] = [s+' '+name_ta[i] if s!='' else name_ta[i] for s in df_i.loc[df_p['Ticker'].to_list(),cat_name].to_list()]
else:
df_i[name_ta[i]] = 0
df_i.loc[df_p['Ticker'].to_list(),name_ta[i]] = 1
return
#############################################################################
# 追加パラメータ
url = 'https://finviz.com/screener.ashx?v=111&ft=4'
site = requests.get(url, headers={'User-Agent': 'Custom'}, timeout=3.5)
data = BeautifulSoup(site.text,'html.parser')
value_list = [[s['value'] for s in dat.find_all('option') if 'value' in str(s)] for dat in data.find_all("select")]
name_list = [[s.text.strip() for s in dat.find_all('option') if 'value' in str(s)] for dat in data.find_all("select")]
#############################################################################
def get_param(df, num, pre_str, first_cut, last_cut ,cat_name=''):
if first_cut:
value_list[num].pop(0)
name_list[num].pop(0)
if last_cut:
value_list[num].pop(-1)
name_list[num].pop(-1)
ret_param = [pre_str+s.replace('v=111','').replace('ft=4','').replace('screener.ashx?','').replace('&','') for s in value_list[num]]
ret_name = name_list[num]
set_param(df, ret_name, ret_param, cat_name)
return
#############################################################################
get_param(df, 3, '', True, False) # Signal
get_param(df, 4, 'f=exch_', True, True, 'Exchange') # Exchange
get_param(df, 5, 'f=idx_', True, False, 'Index') # Index
get_param(df, 42, 'f=sh_opt_', True, True) # Option/Short
get_param(df, 58, 'f=ta_candlestick_', True, True, 'Candlestick') # Candlestick
#############################################################################
# RS CALC
df_rs = df.copy()
df_rs = df_rs.fillna({'Perf Week': 0, 'Perf Month': 0, 'Perf Quart': 0, 'Perf Half': 0, 'Perf Year': 0})
# RS 計算でETFの除きたい場合は以下のコメントを外す
# df_rs = df_rs[df_rs['Industry']!='Exchange Traded Fund']
df_rs['price_mid'] = df_rs['Perf Quart']
df_rs.loc[(df_rs['price_mid'] == 0), 'price_mid'] = df_rs['Perf Month']
df_rs.loc[(df_rs['price_mid'] == 0), 'price_mid'] = df_rs['Perf Week']
df_rs['price_last'] = df_rs['Perf Year']
df_rs.loc[(df_rs['price_last'] == 0), 'price_last'] = df_rs['Perf Half']
df_rs.loc[(df_rs['price_last'] == 0), 'price_last'] = df_rs['Perf Quart']
df_rs.loc[(df_rs['price_last'] == 0), 'price_last'] = df_rs['Perf Month']
df_rs.loc[(df_rs['price_last'] == 0), 'price_last'] = df_rs['Perf Week']
df_rs['POS_NOW'] = 100*(1+df_rs['price_last'])
df_rs['POS_MID'] = df_rs['POS_NOW'] / (1+df_rs['price_mid'])
df_rs['RS_Sort'] = df_rs['POS_MID']+(df_rs['POS_NOW']-df_rs['POS_MID'])*2
df_rs.sort_values('RS_Sort', ascending=True, inplace=True)
df_rs['RS']=[s/(len(df_rs)+1)*100 for s in range(1,len(df_rs)+1)]
df['RS'] = 0
df.loc[df_rs.index, 'RS'] = df_rs['RS']
#############################################################################
out_file = data_dir+'stock_data.csv'
df.to_csv(out_file, encoding='utf_8_sig')
elapsed_time = time.time() - start
print("\nelapsed_time: {0}".format(elapsed_time) + "[sec]")
print("Save:",out_file)now reading -->> Marubozu Black : AAAU(1) ---
elapsed_time: 298.1033458709717[sec]
Save: /content/drive/MyDrive/input/stock_data.csv
こんな感じで5分から10分ぐらいかかります。ファイルがあることを確認しましょう。GoogleDriveに移動します。
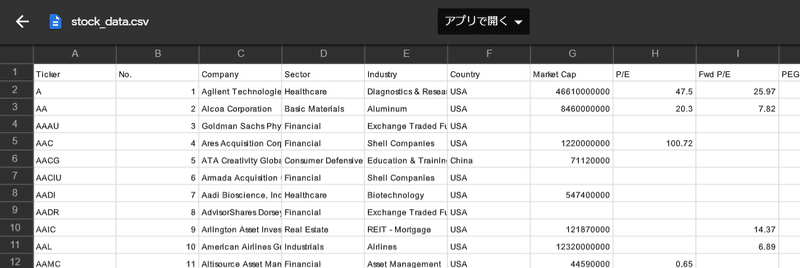
input以下にファイルができているのをご確認ください。

データベースの説明
それでは作成したデータベースの中身の説明を行います。stock_db.csvをダブルクリックすることでこのように開くことはできます。
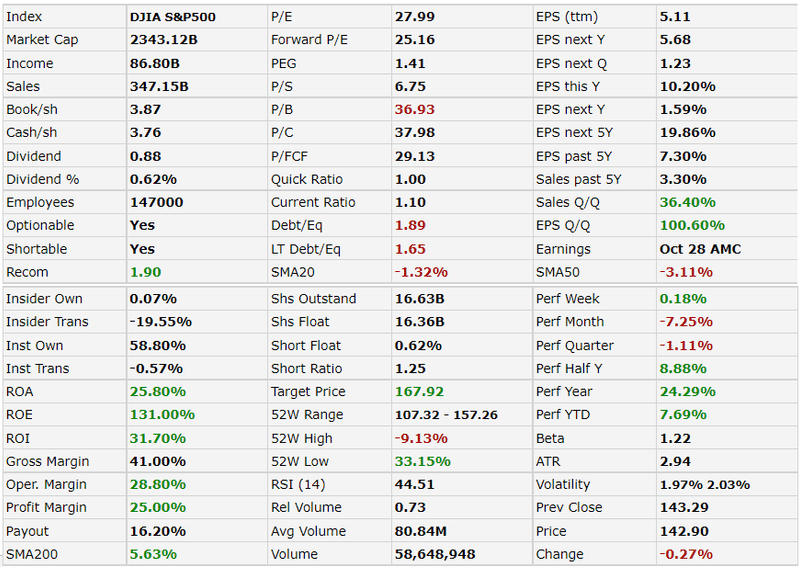
出来れば一度、ローカルに保存する為に、右クリックからダウンロードで保存してみましょう。今回、Finvizの生データすべて(有料部分は除く)及び、Finvizが作っているスクリーニング結果(チャートの形でのスクリーニング等)のすべてを取り込んでいます。それでは内容について、10/9時点のAAPLで説明します。以下がFinvizのAAPL詳細データです。
それに対して、今回取得できたデータは以下です。見比べてみると、どのデータを取得できたかが分かりやすいと思います。(追加でExchange, Index, Optionable, Shortable, Candlestickを追加しました。CandleStickタイプでのスクリーニングも可能です。)
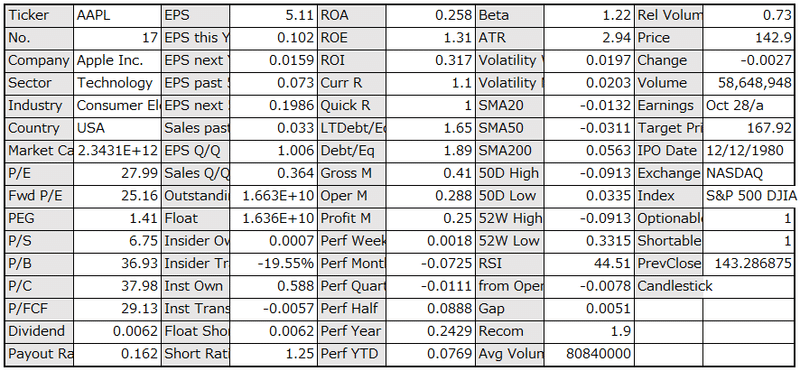
上記の取得データとFinvizのAAPL詳細を見比べてみると分かりやすいと思います。以下がFinviz出力でサポートしている場所です。
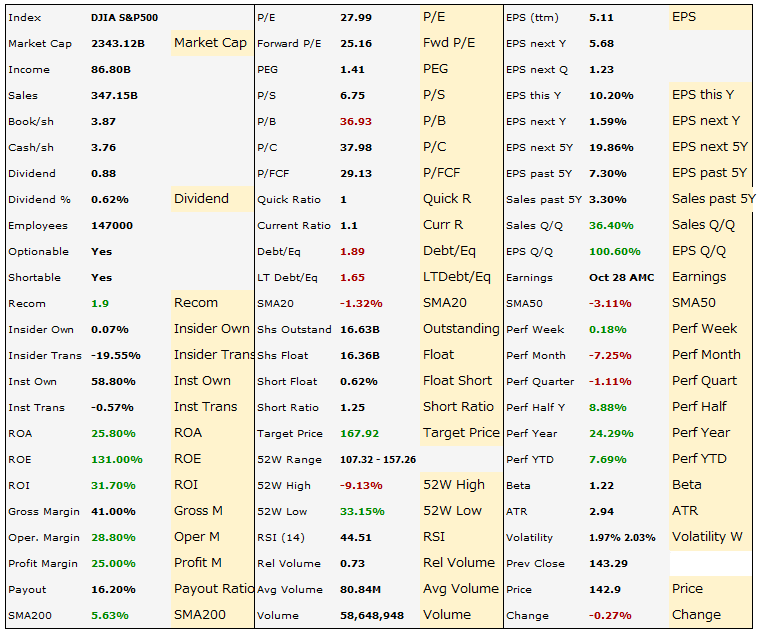
EPS Estimateが出力されていないようです。ただし、これに加えて、追加出力が、50D High, 50D Low, from Open, Gap, IPO Dateです。
ほぼ、名前から想像できる項目ですが、分かりにくいものに関してのみ説明します。
Gap : 前日の終値と当日の始値のギャップ率
Recom : アナリストの推奨度(1 = 買い, 5 = 売り)
Rel Volume : 過去3ヵ月の出来高の平均と前日の出来高を比べた比率
次に、追加したFinvizスクリーニング項目を説明します。この項目はFinvizのスクリーニング機能で選択できるSignal部分になります。
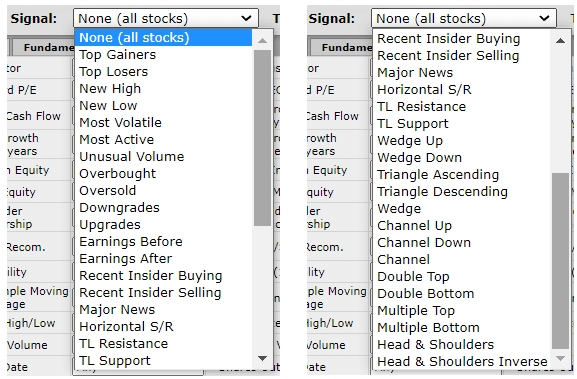
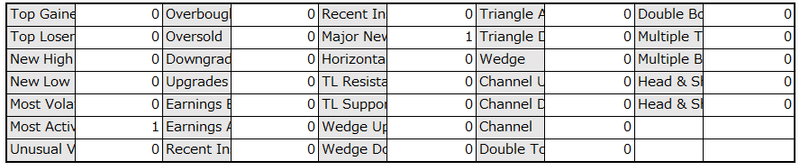
これを使うことでチャートの形でのスクリーニングもできます。チャートの形がマッチしているものに1を入力してます。
自分スクリーニング
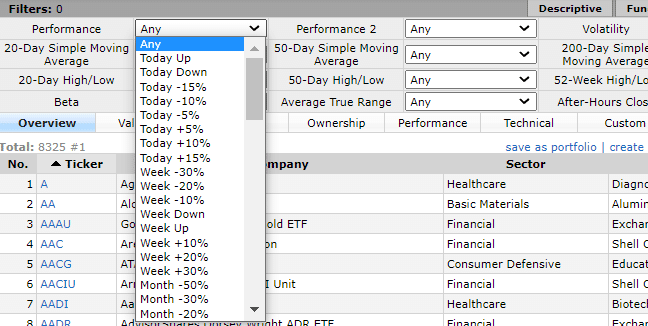
Finvizでもスクリーニングはできますが、ある程度決まったスクリーニングしかできません。例えば昨日のパフォーマンスを見たい場合スクリーニング条件は以下の通りです。細かいパーセンテージの指定や、複合的なスクリーニング(日、週、月のパフォーマンスを合わせたり)ができません。(項目が変わればできます。)
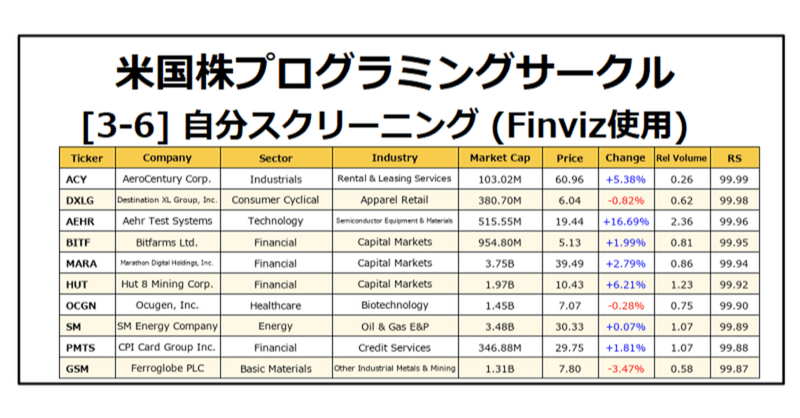
その為、データを一度すべてダウンロードして、自分が好きな条件でスクリーニングします。さらに、そのデータを使って自分の新しい指標も作れます。今回、新しく作った指標、RS(マーケットスミスが使っている指標)のトップ10ランキング表を作ってみました。
module_dir = '/content/drive/MyDrive/module'
data_dir = '/content/drive/MyDrive/input/'
font_dir = '/content/drive/MyDrive/fonts/'
out_dir = '/content/drive/MyDrive/output/'
import os
import sys
sys.path.append(module_dir)
import pandas as pd
from bs4 import BeautifulSoup
import re
import requests
import time
from PIL import Image, ImageDraw, ImageFont

######################################################
jap_font = '/content/drive/MyDrive/module/japanize_matplotlib/fonts/ipaexg.ttf'
japb_font = '/content/drive/MyDrive/module/japanize_matplotlib/fonts/ipaexg.ttf'
jap2_font = font_dir+'meiryo.ttc'
jap2b_font = font_dir+'meiryob.ttc'
if os.path.exists(jap2_font): jap_font = jap2_font
if os.path.exists(jap2b_font): japb_font = jap2b_font
######################################################

df = pd.read_csv(data_dir+'stock_data.csv', index_col=0)

######################################################
# スクリーニング設定
# RS上位10銘柄(同じ場合は時価総額順)
df = df.dropna(subset={'Market Cap'}) # 時価総額が無い物を消す
df.sort_values(['RS','Market Cap'], ascending = [False,False], inplace = True)
df=df[:10]
######################################################

######################################################
conv_nums = ['Market Cap','Outstanding','Float','Avg Volume']
conv_float = ['P/E','Fwd P/E','PEG','P/S','P/B','P/C','P/FCF','EPS','Short Ratio','Curr R','Quick R','LTDebt/Eq',
             'Debt/Eq','Beta','ATR','RSI','Recom','Rel Volume','Price','Target Price','RS','PrevClose']
conv_pct = ['Dividend','Payout Ratio','EPS this Y','EPS next Y','EPS past 5Y','EPS next 5Y','Sales past 5Y','EPS Q/Q','Sales Q/Q',
           'Insider Own','Inst Own','Inst Trans','Float Short','ROA','ROE','ROI','Gross M','Oper M','Profit M',
           'Perf Week','Perf Month','Perf Quart','Perf Half','Perf Year','Perf YTD',
           'Volatility W','Volatility M','SMA20','SMA50','SMA200','50D High','50D Low','52W High','52W Low',
           'from Open','Gap','Change']
conv_str = {'Company','Sector','Industry','Country','Earnings','IPO Date','Exchange','Index','Candlestick'}
conv_other = {'Optionable','Shortable'}
conv_technical = { 'Top Gainers','Top Losers','New High','New Low','Most Volatile','Most Active','Unusual Volume',
                 'Overbought','Oversold','Downgrades','Upgrades','Earnings Before','Earnings After','Recent Insider Buying',
                 'Recent Insider Selling','Major News','Horizontal S/R','TL Resistance','TL Support','Wedge Up','Wedge Down',
                 'Triangle Ascending','Triangle Descending','Wedge','Channel Up','Channel Down','Channel','Double Top',
                 'Double Bottom','Multiple Top','Multiple Bottom','Head & Shoulders','Head & Shoulders Inverse'}
######################################################
# 出力条件設定(出力カテゴリ:カラム横サイズ)
x_width = {'Company':150,'Sector':160,'Industry':180,'Market Cap':120,
          'Price':80,'Change' :80,'Rel Volume':80,'RS' :70
}
x_width_ticker = 80
y_height_hd = 30 # ヘッダ用 縦サイズ
y_height = 30 # 縦サイズ
######################################################

######################################################
def xycenter(xp, yp, xw, yw, tx, fn):
 x,y = draw.textsize(tx,fn)
 return xp+(xw-x)/2, yp+(yw-y)/2
######################################################
def adjust_font(txt_data, check_width, fnt_name, max_size):
 tmp_font = ImageFont.truetype(fnt_name, max_size)
 x_size = draw.textsize(txt_data,tmp_font)[0]
 while (check_width-5)<x_size:
   max_size-=1
   tmp_font = ImageFont.truetype(fnt_name, max_size)
   x_size = draw.textsize(txt_data,tmp_font)[0]
 return tmp_font
######################################################

im = Image.new('RGB', (sum(x_width.values())+x_width_ticker+20, y_height_hd+(len(df))*y_height+20), 'white')
draw = ImageDraw.Draw(im)

x_start = 10
y_start = 10
xpos = x_start
ypos = y_start
max_font = 14
# ヘッダ出力 #####
font_head=ImageFont.truetype(japb_font, max_font)
draw.rectangle([(xpos, ypos), (xpos+x_width_ticker, ypos+y_height_hd)], fill=(247, 203, 77), outline=(0,0,0),  width=1)
draw.text((xycenter(xpos,ypos,x_width_ticker,y_height_hd,'Ticker',font_head)),'Ticker', (0,0,0),font=font_head)
xpos+=x_width_ticker
for i in x_width:
 draw.rectangle([(xpos, ypos), (xpos+x_width[i], ypos+y_height_hd)], fill=(247, 203, 77), outline=(0,0,0),  width=1)
 font_txt = adjust_font(i,x_width[i],japb_font,max_font)
 draw.text((xycenter(xpos,ypos,x_width[i],y_height_hd,i,font_txt)),i, (0,0,0),font=font_txt)
 xpos+=x_width[i]

# データ出力 ####
font_txt=ImageFont.truetype(jap_font, 16)
ypos+=y_height_hd
for j in range(len(df)):
 xpos = x_start
 draw.rectangle([(xpos, ypos), (xpos+sum(x_width.values())+x_width_ticker, ypos+y_height)], outline=(0,0,0),  width=1
   , fill=((255,255,255) if j%2 == 0 else (254, 248, 227)))

 # データ ####
 draw.rectangle([(xpos, ypos), (xpos+x_width_ticker, ypos+y_height)], outline=(0,0,0),  width=1)
 draw.text((xpos+10,ypos+(y_height-draw.textsize(df.index[j],font_head)[1])/2),df.index[j], (0,0,0),font=font_head)
 xpos+=x_width_ticker
 for i in x_width:
   draw.rectangle([(xpos, ypos), (xpos+x_width[i], ypos+y_height)], outline=(0,0,0),  width=1)
   txt_color = (0,0,0)
   if i in conv_nums:
     str_txt = (lambda x: '%.2f'%(x/float('1E'+str(3*'{:,}'.format(x).count(','))))+['','K','M','B','T']['{:,}'.format(x).count(',')])(df[i][j])
   elif i in conv_float:
     str_txt = '{:.2f}'.format(df[i][j])
   elif i in conv_pct:
     str_txt = '{:+.2%}'.format(df[i][j])
     txt_color = 'red' if str_txt[:1]=='-' else 'blue'
   else:
     str_txt = str(df[i][j])
   font_txt = adjust_font(str_txt,x_width[i],jap_font,max_font)
   draw.text((xycenter(xpos,ypos,x_width[i],y_height,str_txt,font_txt)),str_txt, txt_color,font=font_txt)
   xpos+=x_width[i]
 ypos+=y_height

out_file = out_dir+'tmp.png'
im.save(out_file)
import IPython
IPython.display.Image(out_file)
出力結果は以下の通りです。
課題)
1日、1週間、1か月のパフォーマンスランキング表、TOP10を作ってみましょう。Candlestickタイプ別のスクリーニングや複合的な組み合わせも試してみましょう。
次に、セクタ別や業界別のランキング表を作ってみました。こちらはジュースをおごっていただいた方の特典にしております。出力結果はこちらです。
コードはこちら。
module_dir = '/content/drive/MyDrive/module'
data_dir = '/content/drive/MyDrive/input/'
font_dir = '/content/drive/MyDrive/fonts/'
out_dir = '/content/drive/MyDrive/output/'
import os
import sys
sys.path.append(module_dir)
import pandas as pd
from bs4 import BeautifulSoup
import re
import requests
import time
from PIL import Image, ImageDraw, ImageFont

######################################################
jap_font = '/content/drive/MyDrive/module/japanize_matplotlib/fonts/ipaexg.ttf'
japb_font = '/content/drive/MyDrive/module/japanize_matplotlib/fonts/ipaexg.ttf'
jap2_font = font_dir+'meiryo.ttc'
jap2b_font = font_dir+'meiryob.ttc'
if os.path.exists(jap2_font): jap_font = jap2_font
if os.path.exists(jap2b_font): japb_font = jap2b_font


df = pd.read_csv(data_dir+'stock_data.csv', index_col=0)
# ETF 削除
df = df[df['Industry'] != 'Exchange Traded Fund']

im = Image.new('RGB', (1290, 1170), 'white')
draw = ImageDraw.Draw(im)

######################################################
def xycenter(xp, yp, xw, yw, tx, fn):
 x,y = draw.textsize(tx,fn)
 return xp+(xw-x)/2, yp+(yw-y)/2
######################################################
def adjust_font(txt_data, check_width, fnt_name, max_size):
 tmp_font = ImageFont.truetype(fnt_name, max_size)
 x_size = draw.textsize(txt_data,tmp_font)[0]
 while (check_width-5)<x_size:
   max_size-=1
   tmp_font = ImageFont.truetype(fnt_name, max_size)
   x_size = draw.textsize(txt_data,tmp_font)[0]
 return tmp_font
######################################################

x_start = 10
y_start = 10
max_font = 14
y_height = 30

######################################################
def print_list(df, cate, ptype, xpos, ypos, nums=0, asc=False):
 x_init = xpos
 header = {'No.':30,cate:160,'Count':50,ptype:60}
 data = df[[cate,ptype]].groupby([cate]).agg(['count','mean']).sort_values((ptype,'mean'),ascending = asc)
 if nums!=0:
   data = data[:nums]

 # ヘッダ出力 #####
 for i in header:
   draw.rectangle([(xpos, ypos), (xpos+header[i], ypos+y_height)], fill=(247, 203, 77), outline=(0,0,0),  width=1)
   font_txt = adjust_font(str(i),header[i],japb_font,max_font)
   draw.text((xycenter(xpos,ypos,header[i],y_height,str(i),font_txt)),str(i), (0,0,0),font=font_txt)
   xpos+=header[i]
 # データ出力 ####
 ypos+=y_height
 for j in range(len(data)):
   xpos = x_init
   draw.rectangle([(xpos, ypos), (xpos+sum(list(header.values())), ypos+y_height)], outline=(0,0,0),  width=1
     , fill=((255,255,255) if j%2 == 0 else (254, 248, 227)))
   if ptype=='RS':
     datas = [j+1, data.index[j], '{:.0f}'.format(data.loc[data.index[j],data.columns[0]]), '{:.0f}'.format(data.loc[data.index[j],data.columns[1]])]
   else:
     datas = [j+1, data.index[j], '{:.0f}'.format(data.loc[data.index[j],data.columns[0]]), '{:+.2%}'.format(data.loc[data.index[j],data.columns[1]])]

   cnt=0
   for i in datas:
     draw.rectangle([(xpos, ypos), (xpos+list(header.values())[cnt], ypos+y_height)], outline=(0,0,0),  width=1)
     font_txt = adjust_font(str(i),list(header.values())[cnt],jap_font,max_font)
     draw.text((xycenter(xpos,ypos,list(header.values())[cnt],y_height,str(i),font_txt)),str(i), 'blue' if str(i)[:1]=='+' else 'red' if str(i)[:1]=='-' else 'black',font=font_txt)
     xpos+=list(header.values())[cnt]
     cnt+=1
   ypos+=y_height
 return
######################################################
font_head=ImageFont.truetype(japb_font, 16)

######################################################
# Sector
# Day RS ---
xpos = x_start
ypos = y_start
draw.text((xpos,ypos),' Sector RS Ranking','black',font=font_head)
print_list(df, 'Sector', 'RS', xpos, ypos+30)
# Day Change ---
xpos = x_start+320
draw.text((xpos,ypos),' Sector Day Ranking','black',font=font_head)
print_list(df, 'Sector', 'Change', xpos, ypos+30)
# Day Week ---
xpos = x_start+320*2
draw.text((xpos,ypos),' Sector Week Ranking','black',font=font_head)
print_list(df, 'Sector', 'Perf Week', xpos, ypos+30)
# Day Month ---
xpos = x_start+320*3
draw.text((xpos,ypos),' Sector Month Ranking','black',font=font_head)
print_list(df, 'Sector', 'Perf Month', xpos, ypos+30)
######################################################

######################################################
# Industry
# Day RS ---
xpos = x_start
ypos = y_start+405
draw.text((xpos,ypos),' Industry Best10 RS Ranking','black',font=font_head)
print_list(df, 'Industry', 'RS', xpos, ypos+30, 10)
# Day Change ---
xpos = x_start+320
draw.text((xpos,ypos),' Industry Best10 Day Ranking','black',font=font_head)
print_list(df, 'Industry', 'Change', xpos, ypos+30, 10)
# Day Week ---
xpos = x_start+320*2
draw.text((xpos,ypos),' Industry Best10 Week Ranking','black',font=font_head)
print_list(df, 'Industry', 'Perf Week', xpos, ypos+30, 10)
# Day Month ---
xpos = x_start+320*3
draw.text((xpos,ypos),' Industry Best10 Month Ranking','black',font=font_head)
print_list(df, 'Industry', 'Perf Month', xpos, ypos+30, 10)
######################################################

######################################################
# Industry
# Day RS ---
xpos = x_start
ypos = y_start+405+375
draw.text((xpos,ypos),' Industry Worst10 RS Ranking','black',font=font_head)
print_list(df, 'Industry', 'RS', xpos, ypos+30, 10, True)
# Day Change ---
xpos = x_start+320
draw.text((xpos,ypos),' Industry Worst10 Day Ranking','black',font=font_head)
print_list(df, 'Industry', 'Change', xpos, ypos+30, 10, True)
# Day Week ---
xpos = x_start+320*2
draw.text((xpos,ypos),' Industry Worst10 Week Ranking','black',font=font_head)
print_list(df, 'Industry', 'Perf Week', xpos, ypos+30, 10, True)
# Day Month ---
xpos = x_start+320*3
draw.text((xpos,ypos),' Industry Worst10 Month Ranking','black',font=font_head)
print_list(df, 'Industry', 'Perf Month', xpos, ypos+30, 10, True)
######################################################

out_file = out_dir+'tmp.png'
im.save(out_file)
import IPython
IPython.display.Image(out_file)
以上
ここから先は
¥ 150
サポートいただけますと、うれしいです。より良い記事を書く励みになります!