
つみたて投資、出口戦略検証

こんにちわ!トミィ(@toushi_tommy)です!投資信託の購入に関してはある程度の解は出たと思いますので、今回は出口戦略を考えてみました。出口戦略を考えるうえで、証券会社を分けて購入した方が良い可能性もありますので、以下をご覧ください。
記事はすべて無料です。記事を気に入っていただけた方でジュースおごっていただける方がいらっしゃいましたら、非常に喜びます!!
まずは、過去の記事をご覧になると、購入戦略が明確になると思います。あくまでも私の見解ですので、もちろん状況によって変わってくることはご了承ください。
つみたてNISAか一般NISAか
結論:誰にとっても「つみたてNISA」が一番良い
ETFか投資信託か
結論:誰にとっても「投資信託」が良い
毎日・毎月・毎年積み立てはどれがいい
結論:毎日積み立てが一番いい
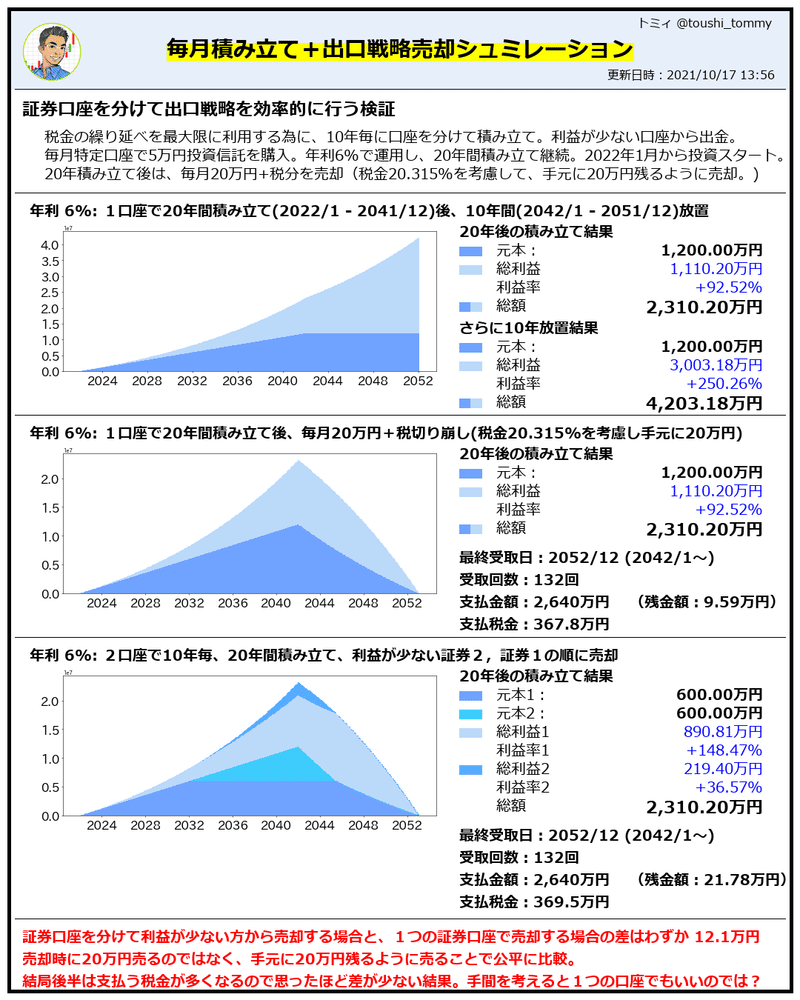
税の繰り延べ効果の為、証券口座を分けた方が良い
結論:分けた方がお得であるが、思ったほどの効果はない
以下、計算してみました。年利6%で証券口座を二つに分け、税金の繰り延べ効果を最大限に発揮する為、最初の10年、次の10年で二つに分け、利益が少ない口座から売却していった場合、差額はわずか12.1万円でした。労力に対する差が少ない為、1つの口座でも良いかなと思います。
プログラミングサークルの方で同様に検証したい場合は以下をお使いください。計算に使ったコードになります。
##############################################
# PATH
module_dir = '/content/drive/MyDrive/module'
img_dir    = '/content/drive/MyDrive/input/'
output_dir = '/content/drive/MyDrive/output/'
font_dir   = '/content/drive/MyDrive/fonts/'
##############################################
import os
if not os.path.isdir(output_dir): os.makedirs(output_dir)
import sys
sys.path.append(module_dir)
import datetime as datetime
import pytz
from PIL import Image, ImageDraw, ImageFont
import IPython
from bs4 import BeautifulSoup
import re
import requests
from datetime import datetime as dt
import matplotlib.dates as mdates
import japanize_matplotlib
from matplotlib import ticker
import pandas as pd
import numpy as np
import matplotlib.pyplot as plt
import warnings
warnings.simplefilter('ignore')
import itertools

## 設定個所 ###################################
icon_img = img_dir+"tommy_icon2.png"
txt_comm = 'トミィ @toushi_tommy'
title = '毎月積み立て+出口戦略売却シュミレーション'
###############################################
# フォント
jap_font = '/content/drive/MyDrive/module/japanize_matplotlib/fonts/ipaexg.ttf'
jap2_font = font_dir+'meiryo.ttc'
japb_font = '/content/drive/MyDrive/module/japanize_matplotlib/fonts/ipaexg.ttf'
jap3_font = font_dir+'meiryob.ttc'
if os.path.exists(jap2_font): jap_font = jap2_font
if os.path.exists(jap3_font): japb_font = jap3_font

######################################################
def xycenter(xp, yp, xw, yw, tx, fn):
 x,y = draw.textsize(tx,fn)
 return xp+(xw-x)/2, yp+(yw-y)/2
ycenter = lambda yp,yw,tx,fn : yp+(yw-draw.textsize(tx,fn)[1])/2
xcenter = lambda xp,xw,tx,fn : xp+(xw-draw.textsize(tx,fn)[0])/2
######################################################

###############################################
x_height_all = 1080
y_height_all = 1350
###############################################
# 色
col_back = 'white' # heatmap (38,41,49)
col_txt  = 'black'  # heatmap 'white'
col_line =  'black'  # heatmap 'white'
col_head = (231, 239, 252)

###############################################
im = Image.new('RGB', (x_height_all, y_height_all), col_back)
draw = ImageDraw.Draw(im)
today_j = datetime.datetime.now(pytz.timezone('Asia/Tokyo'))
# フォント ####################################
font_date   = ImageFont.truetype(jap_font, 30)
font_header = ImageFont.truetype(japb_font, 30)
font_subtit = ImageFont.truetype(jap_font, 28)
font_subtit2 = ImageFont.truetype(jap_font, 20)
font_sign   = ImageFont.truetype(jap_font, 16)
font_att   = ImageFont.truetype(japb_font, 16)

###############################################
# ヘッダ作成
len_title=draw.textsize(title, font_header)[0]
draw.rectangle([(10, 10), (x_height_all-10, 120)], fill=col_head)
draw.rectangle([(10, 10), (x_height_all-10, y_height_all-10)], outline=col_line, width=5)
if os.path.exists(icon_img):im.paste(Image.open(icon_img).resize((80, 80)).copy(), (30, 30))
x_pos = x_height_all/2-len_title/2
draw.line((x_pos, 70, x_pos+len_title,70), fill='yellow', width=25)
draw.text((x_pos, 45),title,col_txt,font=font_header)
draw.text((x_height_all-220, 20),txt_comm,col_txt,font=font_sign)
draw.text((x_height_all-260, 90),"更新日時:"+today_j.strftime("%Y/%m/%d %H:%M"),col_txt,font=font_sign)
draw.line((20,120, x_height_all-20,120), fill=col_line, width=1)
###############################################

kinri = 6
kinri_rate = kinri * 0.01/12

draw.text((30, 130),"証券口座を分けて出口戦略を効率的に行う検証",'black',font=ImageFont.truetype(japb_font, 24))
draw.text((60, 170),"税金の繰り延べを最大限に利用する為に、10年毎に口座を分けて積み立て。利益が少ない口座から出金。",'black',font=ImageFont.truetype(jap_font, 20))
draw.text((60, 195),"毎月特定口座で5万円投資信託を購入。年利"+str(kinri)+"%で運用し、20年間積み立て継続。2022年1月から投資スタート。",'black',font=ImageFont.truetype(jap_font, 20))
draw.text((60, 220),"20年積み立て後は、毎月20万円+税分を売却(税金20.315%を考慮して、手元に20万円残るように売却。)",'black',font=ImageFont.truetype(jap_font, 20))

col1 = (112,163,255)
str_col1 = '#70A3FF'
col2 = (188,217,249)
str_col2 = '#BCD9F9'
col3 = (61,204,252)
str_col3 = '#3DCCFC'
col4 = (86,172,255)
str_col4 = '#56ACFF'

xoff = lambda xw,tx,fn : (xw-draw.textsize(tx,fn)[0])

fnt20b=ImageFont.truetype(japb_font, 20)
fnt20 = ImageFont.truetype(jap_font, 20)
fntttl = ImageFont.truetype(japb_font, 23)

##########################################################################################
# CASE1
y_loc = 270
draw.line((20, y_loc-10, x_height_all-20, y_loc-10), fill=col_line, width=1)

draw.text((40, y_loc),"年利 "+str(kinri)+"%: 1口座で20年間積み立て(2022/1 - 2041/12)後、10年間(2042/1 - 2051/12)放置",'black',font=ImageFont.truetype(japb_font, 20))

df = pd.DataFrame({"Date" : pd.date_range('2022-01-01', '2041-12-31', freq='M')})
df['積立'] = 50000
df['売却'] = 0
df2 = pd.DataFrame({"Date" : pd.date_range('2042-01-01', '2051-12-31', freq='M')})
df2['積立'] = 0
df2['売却'] = 0
df = pd.concat([df, df2], axis=0)
df['Rate'] = kinri_rate

df['元本'] = df['積立'].cumsum()
df = df.reset_index(drop=True)

df['総額'] = list(itertools.accumulate([df['積立'][0]]+list(range(1,len(df))), func=lambda x,y:x*(1+df['Rate'][y])+df['積立'][y]))
df['総利益'] = df['総額']-df['元本']
df['利益率'] = df['総利益']/df['元本']
df.to_csv(output_dir+'case1.csv')

plt.figure(figsize=(13, 5), dpi=50)
plt.bar(df["Date"], df['元本'], color=str_col1,width=50.0)
plt.bar(df["Date"], df['総利益'], bottom=df['元本'], color=str_col2,width=50.0)
plt.xticks(fontsize=24)
plt.yticks(fontsize=24)
outfile = output_dir+'graph.png'
plt.savefig(outfile, bbox_inches="tight")
plt.close()
im.paste(Image.open(outfile).copy(), (50, y_loc+30))

pos = 28
draw.text((620, y_loc+pos),"20年後の積み立て結果",'black',font=fnt20b)
pos +=25
draw.rectangle([(620, y_loc+pos+10), (650, y_loc+pos+22)], fill=col1)
draw.text((670, y_loc+pos),"元本:",'black',font=fnt20)
num='{:,.2f}万円'.format(int(df.loc[239,'元本'])/10000)
draw.text((870+xoff(160,num,fnt20b), y_loc+pos),num,'black',font=fnt20b)
pos +=25
draw.rectangle([(620, y_loc+pos+10), (650, y_loc+pos+22)], fill=col2)
draw.text((670, y_loc+pos),"総利益",'black',font=fnt20)
num='{:,.2f}万円'.format(int(df.loc[239,'総利益'])/10000)
draw.text((870+xoff(160,num,fnt20), y_loc+pos),num,'blue',font=fnt20)
pos +=25
draw.text((670, y_loc+pos),"利益率",'black',font=fnt20)
num='{:+.2%}'.format(df.loc[239,'利益率'])
draw.text((870+xoff(160,num,fnt20), y_loc+pos),num,'blue',font=fnt20)
pos +=25
draw.rectangle([(620, y_loc+pos+10), (635, y_loc+pos+22)], fill=col1)
draw.rectangle([(635, y_loc+pos+10), (650, y_loc+pos+22)], fill=col2)
draw.text((670, y_loc+pos),"総額",'black',font=fnt20)
num='{:,.2f}万円'.format(int(df.loc[239,'総額'])/10000)
draw.text((870+xoff(160,num,fntttl), y_loc+pos),num,'black',font=fntttl)

pos +=30
draw.text((620, y_loc+pos),"さらに10年放置結果",'black',font=fnt20b)
pos +=25
draw.rectangle([(620, y_loc+pos+10), (650, y_loc+pos+22)], fill=col1)
draw.text((670, y_loc+pos),"元本:",'black',font=fnt20)
num='{:,.2f}万円'.format(int(df['元本'].iat[-1])/10000)
draw.text((870+xoff(160,num,fnt20b), y_loc+pos),num,'black',font=fnt20b)
pos +=25
draw.rectangle([(620, y_loc+pos+10), (650, y_loc+pos+22)], fill=col2)
draw.text((670, y_loc+pos),"総利益",'black',font=fnt20)
num='{:,.2f}万円'.format(int(df['総利益'].iat[-1])/10000)
draw.text((870+xoff(160,num,fnt20), y_loc+pos),num,'blue',font=fnt20)
pos +=25
draw.text((670, y_loc+pos),"利益率",'black',font=fnt20)
num='{:+.2%}'.format(df['利益率'].iat[-1])
draw.text((870+xoff(160,num,fnt20), y_loc+pos),num,'blue',font=fnt20)
pos +=25
draw.rectangle([(620, y_loc+pos+10), (635, y_loc+pos+22)], fill=col1)
draw.rectangle([(635, y_loc+pos+10), (650, y_loc+pos+22)], fill=col2)
draw.text((670, y_loc+pos),"総額",'black',font=fnt20)
num='{:,.2f}万円'.format(int(df['総額'].iat[-1])/10000)
draw.text((870+xoff(160,num,fntttl), y_loc+pos),num,'black',font=fntttl)

#########################################################################################################
y_loc = 270+300
draw.line((20, y_loc-10, x_height_all-20, y_loc-10), fill=col_line, width=1)

draw.text((40, y_loc),"年利 "+str(kinri)+"%: 1口座で20年間積み立て後、毎月20万円+税切り崩し(税金20.315%を考慮し手元に20万円)",'black',font=ImageFont.truetype(japb_font, 20))

pay = 200000
df = pd.DataFrame({"Date" : pd.date_range('2022-01-01', '2041-12-31', freq='M')})
df['積立'] = 50000
df['売却'] = 0
df['受取'] = 0
df['Rate'] = kinri_rate

df['元本'] = df['積立'].cumsum()

df['総額'] = list(itertools.accumulate([df['積立'][0]]+list(range(1,len(df))), func=lambda x,y:x*(1+df['Rate'][y])+df['積立'][y]))
df['総利益'] = df['総額']-df['元本']
df['利益率'] = df['総利益']/df['元本']

df2 = pd.DataFrame({"Date" : pd.date_range('2042-01-01', '2061-12-31', freq='M')})
df2['積立'] = 0
df2['売却'] = pay
df2['受取'] = 0
df2['Rate'] = kinri_rate
df2['総額']=0
df2['総額'][0] = df['総額'][len(df)-1]
df2['元本']=0
df2['元本'][0] = df['元本'][len(df)-1]
df2['総利益']=0
df2['総利益'][0] = df['総利益'][len(df)-1]
df2['利益率']=0
df2['利益率'][0] = df['利益率'][len(df)-1]

ganpon = df['元本'][len(df)-1]
rieki = df['総利益'][len(df)-1]
rieki_ritsu = df['総利益'][len(df)-1]
all_pay = 0
all_tax = 0
sougaku = ganpon + rieki
for i in range(len(df2)):
 # 最初に増やす
 sougaku = sougaku * (1+0.05/12)
 rieki = (sougaku-ganpon)
 rieki_ritsu = rieki/ganpon
 sell = pay/(1-rieki/sougaku*0.20315)
 all_pay = all_pay + pay
 all_tax = all_tax + sell - pay
 ganpon = ganpon - sell*ganpon/sougaku
 rieki = rieki - sell*rieki/sougaku
 rieki_ritsu = rieki/ganpon
 sougaku = ganpon+rieki
 df2['売却'][i] = sell
 df2['受取'][i] = pay
 df2['元本'][i] = ganpon
 df2['総利益'][i] = rieki
 df2['総額'][i] = sougaku
 if sougaku<pay:
   break

df = pd.concat([df, df2], axis=0)
df = df.reset_index(drop=True)
df['利益率'] = df['総利益']/df['元本']
df = df[df['総額']>0]

df.to_csv(output_dir+'case2.csv')

plt.figure(figsize=(13, 5), dpi=50)
plt.bar(df["Date"], df['元本'], color=str_col1,width=50.0)
plt.bar(df["Date"], df['総利益'], bottom=df['元本'], color=str_col2,width=50.0)
plt.xticks(fontsize=24)
plt.yticks(fontsize=24)
outfile = output_dir+'graph.png'
plt.savefig(outfile, bbox_inches="tight")
plt.close()
im.paste(Image.open(outfile).copy(), (50, y_loc+30))

pos = 28
draw.text((620, y_loc+pos),"20年後の積み立て結果",'black',font=fnt20b)
pos +=25
draw.rectangle([(620, y_loc+pos+10), (650, y_loc+pos+22)], fill=col1)
draw.text((670, y_loc+pos),"元本:",'black',font=fnt20)
num='{:,.2f}万円'.format(int(df.loc[239,'元本'])/10000)
draw.text((870+xoff(160,num,fnt20b), y_loc+pos),num,'black',font=fnt20b)
pos +=25
draw.rectangle([(620, y_loc+pos+10), (650, y_loc+pos+22)], fill=col2)
draw.text((670, y_loc+pos),"総利益",'black',font=fnt20)
num='{:,.2f}万円'.format(int(df.loc[239,'総利益'])/10000)
draw.text((870+xoff(160,num,fnt20), y_loc+pos),num,'blue',font=fnt20)
pos +=25
draw.text((670, y_loc+pos),"利益率",'black',font=fnt20)
num='{:+.2%}'.format(df.loc[239,'利益率'])
draw.text((870+xoff(160,num,fnt20), y_loc+pos),num,'blue',font=fnt20)
pos +=25
draw.rectangle([(620, y_loc+pos+10), (635, y_loc+pos+22)], fill=col1)
draw.rectangle([(635, y_loc+pos+10), (650, y_loc+pos+22)], fill=col2)
draw.text((670, y_loc+pos),"総額",'black',font=fnt20)
num='{:,.2f}万円'.format(int(df.loc[239,'総額'])/10000)
draw.text((870+xoff(160,num,fntttl), y_loc+pos),num,'black',font=fntttl)

pos +=40
draw.text((620, y_loc+pos),"最終受取日:"+df['Date'].iat[-1].strftime('%Y/%m')+ ' (2042/1~)','black',font=fnt20b)
pos +=30
draw.text((620, y_loc+pos),'受取回数:'+str(len(df)-240)+'回','black',font=fnt20b)
pos +=30
draw.text((620, y_loc+pos),'支払金額:'+'{:,.0f}万円'.format(int(all_pay)/10000),'black',font=fnt20b)
draw.text((850, y_loc+pos),'(残金額:'+'{:,.2f}万円)'.format(int(df['総額'].iat[-1])/10000),'black',font=fnt20b)
pos +=30
draw.text((620, y_loc+pos),'支払税金:'+'{:,.1f}万円'.format(int(all_tax)/10000),'black',font=fnt20b)

# ###############################################
y_loc = 270+300+300
draw.line((20, y_loc-10, x_height_all-20, y_loc-10), fill=col_line, width=1)

draw.text((40, y_loc),"年利 "+str(kinri)+"%: 2口座で10年毎、20年間積み立て、利益が少ない証券2,証券1の順に売却",'black',font=ImageFont.truetype(japb_font, 20))

pay = 200000
df = pd.DataFrame({"Date" : pd.date_range('2022-01-01', '2031-12-31', freq='M')})
df['積立1'] = 50000
df['積立2'] = 0
df['売却1'] = 0
df['売却2'] = 0
df1 = pd.DataFrame({"Date" : pd.date_range('2032-01-01', '2041-12-31', freq='M')})
df1['積立1'] = 0
df1['積立2'] = 50000
df1['売却1'] = 0
df1['売却2'] = 0
df1['受取1'] = 0
df1['受取2'] = 0
df = pd.concat([df, df1], axis=0)
df = df.reset_index(drop=True)
df['Rate'] = kinri_rate

df['元本1'] = df['積立1'].cumsum()
df['元本2'] = df['積立2'].cumsum()
df['総額1'] = list(itertools.accumulate([df['積立1'][0]]+list(range(1,len(df))), func=lambda x,y:x*(1+df['Rate'][y])+df['積立1'][y]))
df['総額2'] = list(itertools.accumulate([df['積立2'][0]]+list(range(1,len(df))), func=lambda x,y:x*(1+df['Rate'][y])+df['積立2'][y]))

df['総利益1'] = df['総額1']-df['元本1']
df['総利益2'] = df['総額2']-df['元本2']

df['利益率1'] = df['総利益1']/df['元本1']
df['利益率2'] = df['総利益2']/df['元本2']

df2 = pd.DataFrame({"Date" : pd.date_range('2042-01-01', '2061-12-31', freq='M')})
df2['積立1'] = 0
df2['積立2'] = 0
df2['売却1'] = 0
df2['売却2'] = 0
df2['受取1'] = 0
df2['受取2'] = 0

df2['Rate'] = kinri_rate
df2['総額1']=0
df2['総額2']=0
df2['元本1']=0
df2['元本2']=0
df2['総利益1']=0
df2['総利益2']=0

ganpon1 = df['元本1'][len(df)-1]
rieki1 = df['総利益1'][len(df)-1]
ganpon2 = df['元本2'][len(df)-1]
rieki2 = df['総利益2'][len(df)-1]

all_pay = 0
all_tax = 0
sougaku1 = ganpon1 + rieki1
sougaku2 = ganpon2 + rieki2
num=0
for i in range(len(df2)):
 # 最初に増やす
 sougaku1 = sougaku1 * (1+0.05/12)
 sougaku2 = sougaku2 * (1+0.05/12)
 rieki1 = (sougaku1-ganpon1)
 rieki2 = (sougaku2-ganpon2)
 rieki_ritsu1 = rieki1/ganpon1
 rieki_ritsu2 = rieki2/ganpon2
 sell = pay/(1-rieki2/sougaku2*0.20315)
 all_pay = all_pay + pay
 all_tax = all_tax + sell - pay
 ganpon2 = ganpon2 - sell*ganpon2/sougaku2
 rieki2 = rieki2 - sell*rieki2/sougaku2
 rieki_ritsu2 = rieki2/ganpon2
 sougaku2 = ganpon2+rieki2
 df2['売却1'][i] = 0
 df2['受取1'][i] = 0
 df2['元本1'][i] = ganpon1
 df2['総利益1'][i] = rieki1
 df2['総額1'][i] = sougaku1
 df2['売却2'][i] = sell
 df2['受取2'][i] = pay
 df2['元本2'][i] = ganpon2
 df2['総利益2'][i] = rieki2
 df2['総額2'][i] = sougaku2
 if sougaku2<pay:
   num = i+1
   break

for i in range(num,len(df2)):
 # 最初に増やす
 sougaku1 = sougaku1 * (1+0.05/12)
 sougaku2 = sougaku2 * (1+0.05/12)
 rieki1 = (sougaku1-ganpon1)
 rieki2 = (sougaku2-ganpon2)
 rieki_ritsu1 = rieki1/ganpon1
 rieki_ritsu2 = rieki2/ganpon2
 sell = pay/(1-rieki1/sougaku1*0.20315)
 all_pay = all_pay + pay
 all_tax = all_tax + sell - pay
 # print(sougaku,rieki,ganpon,rieki_ritsu,pay,sell)
 ganpon1 = ganpon1 - sell*ganpon1/sougaku1
 rieki1 = rieki1 - sell*rieki1/sougaku1
 rieki_ritsu1 = rieki1/ganpon1
 sougaku1 = ganpon1+rieki1
 # print(sougaku,rieki,ganpon,rieki_ritsu,pay,sell)
 df2['売却1'][i] = sell
 df2['受取1'][i] = pay
 df2['元本1'][i] = ganpon1
 df2['総利益1'][i] = rieki1
 df2['総額1'][i] = sougaku1
 df2['売却2'][i] = 0
 df2['受取2'][i] = 0
 df2['元本2'][i] = ganpon2
 df2['総利益2'][i] = rieki2
 df2['総額2'][i] = sougaku2
 if sougaku1<pay:
   break

df = pd.concat([df, df2], axis=0)
df = df.reset_index(drop=True)

df['総額'] = df['総額1'] + df['総額2']
df['元本'] = df['元本1'] + df['元本2']
df['総利益'] = df['総利益1'] + df['総利益2']
df['利益率1'] = df['総利益1']/df['元本1']
df['利益率2'] = df['総利益2']/df['元本2']
df['利益率'] = df['総利益']/df['元本']
df = df[df['総額']>0]

df.to_csv(output_dir+'case3.csv')

plt.figure(figsize=(13, 5), dpi=50)
plt.bar(df["Date"], df['元本1'], color=str_col1,width=50.0)
plt.bar(df["Date"], df['元本2'], bottom=df['元本1'], color=str_col3,width=50.0)
plt.bar(df["Date"], df['総利益1'], bottom=df['元本1']+df['元本2'], color=str_col2,width=50.0)
plt.bar(df["Date"], df['総利益2'], bottom=df['元本1']+df['元本2']+df['総利益1'], color=str_col4,width=50.0)
plt.xticks(fontsize=24)
plt.yticks(fontsize=24)
outfile = output_dir+'graph.png'
plt.savefig(outfile, bbox_inches="tight")
plt.close()
im.paste(Image.open(outfile).copy(), (50, y_loc+30))

pos = 28
draw.text((620, y_loc+pos),"20年後の積み立て結果",'black',font=fnt20b)
pos +=25
draw.rectangle([(620, y_loc+pos+10), (650, y_loc+pos+22)], fill=col1)
draw.text((670, y_loc+pos),"元本1:",'black',font=fnt20)
num='{:,.2f}万円'.format(int(df.loc[239,'元本1'])/10000)
draw.text((870+xoff(160,num,fnt20b), y_loc+pos),num,'black',font=fnt20b)
pos +=25
draw.rectangle([(620, y_loc+pos+10), (650, y_loc+pos+22)], fill=col3)
draw.text((670, y_loc+pos),"元本2:",'black',font=fnt20)
num='{:,.2f}万円'.format(int(df.loc[239,'元本2'])/10000)
draw.text((870+xoff(160,num,fnt20b), y_loc+pos),num,'black',font=fnt20b)
pos +=25
draw.rectangle([(620, y_loc+pos+10), (650, y_loc+pos+22)], fill=col2)
draw.text((670, y_loc+pos),"総利益1",'black',font=fnt20)
num='{:,.2f}万円'.format(int(df.loc[239,'総利益1'])/10000)
draw.text((870+xoff(160,num,fnt20), y_loc+pos),num,'blue',font=fnt20)
pos +=25
draw.text((670, y_loc+pos),"利益率1",'black',font=fnt20)
num='{:+.2%}'.format(df.loc[239,'利益率1'])
draw.text((870+xoff(160,num,fnt20), y_loc+pos),num,'blue',font=fnt20)
pos +=25
draw.rectangle([(620, y_loc+pos+10), (650, y_loc+pos+22)], fill=col4)
draw.text((670, y_loc+pos),"総利益2",'black',font=fnt20)
num='{:,.2f}万円'.format(int(df.loc[239,'総利益2'])/10000)
draw.text((870+xoff(160,num,fnt20), y_loc+pos),num,'blue',font=fnt20)
pos +=25
draw.text((670, y_loc+pos),"利益率2",'black',font=fnt20)
num='{:+.2%}'.format(df.loc[239,'利益率2'])
draw.text((870+xoff(160,num,fnt20), y_loc+pos),num,'blue',font=fnt20)

pos +=25
# draw.rectangle([(620, y_loc+pos+10), (635, y_loc+pos+22)], fill=col1)
# draw.rectangle([(635, y_loc+pos+10), (650, y_loc+pos+22)], fill=col2)
draw.text((670, y_loc+pos),"総額",'black',font=fnt20)
num='{:,.2f}万円'.format(int(df.loc[239,'総額'])/10000)
draw.text((870+xoff(160,num,fntttl), y_loc+pos),num,'black',font=fntttl)


pos +=40
draw.text((620, y_loc+pos),"最終受取日:"+df['Date'].iat[-1].strftime('%Y/%m')+ ' (2042/1~)','black',font=fnt20b)
pos +=30
draw.text((620, y_loc+pos),'受取回数:'+str(len(df)-240)+'回','black',font=fnt20b)
pos +=30
draw.text((620, y_loc+pos),'支払金額:'+'{:,.0f}万円'.format(int(all_pay)/10000),'black',font=fnt20b)
draw.text((850, y_loc+pos),'(残金額:'+'{:,.2f}万円)'.format(int(df['総額'].iat[-1])/10000),'black',font=fnt20b)
pos +=30
draw.text((620, y_loc+pos),'支払税金:'+'{:,.1f}万円'.format(int(all_tax)/10000),'black',font=fnt20b)

y_loc = 270+300+300+300+80
draw.line((20, y_loc-10, x_height_all-20, y_loc-10), fill=col_line, width=1)

draw.text((30, y_loc),"証券口座を分けて利益が少ない方から売却する場合と、1つの証券口座で売却する場合の差はわずか 12.1万円",'red',font=ImageFont.truetype(japb_font, 20))
draw.text((30, y_loc+30),"売却時に20万円売るのではなく、手元に20万円残るように売ることで公平に比較。",'red',font=ImageFont.truetype(japb_font, 20))
draw.text((30, y_loc+60),"結局後半は支払う税金が多くなるので思ったほど差が少ない結果。手間を考えると1つの口座でもいいのでは?",'red',font=ImageFont.truetype(japb_font, 20))

###############################################
###############################################
outfile = output_dir+'test.png'
im.save(outfile)
IPython.display.Image(outfile)ここから先は
0字
¥ 150
サポートいただけますと、うれしいです。より良い記事を書く励みになります!