[Python]OpenCVを使ってステレオ画像の特徴点から3次元空間をプロットする
はじめに
ステレオ画像とは人の目のように2か所の位置のカメラから取得した画像で、2つで1セットになります。2か所の位置からの画像があると、人間の目のように、ある物体までのおおまかな位置を推定することが可能になります。
今回はOpenCVで画像から特徴量の抽出・マッチングを行い、それらをプロットすることで実際に2枚の画像から3次元空間を作り出すことが可能かを試してみます。
ステレオ画像の準備
Webカメラで1枚写真を取ったあと、少しだけ並行移動させてもう1枚写真をとり、この2枚を1セットとしています。ここで多少の回転が混ざりますが、今回は0として扱います。移動距離についても大体で決めてます(5mmくらい)。先に言うとそれなりの結果がでたのでまあいっかって感じです。
キャリブレーション
コード
def CalibrateCamera():
    global cameraMat, distCoeffs
    criteria = (cv2.TERM_CRITERIA_EPS + cv2.TERM_CRITERIA_MAX_ITER, 30, 0.001)

    objp = np.zeros((9*6,3), np.float32)
    objp[:,:2] = np.mgrid[0:6,0:9].T.reshape(-1,2)

    objpoints = []
    imgpoints = []

    img = cv2.imread(キャリブレーション画像のパス)
    gray = cv2.cvtColor(img,cv2.COLOR_BGR2GRAY)

    ret, corners = cv2.findChessboardCorners(gray, (6,9),None)

    if ret == True:
        objpoints.append(objp)

        corners2 = cv2.cornerSubPix(gray,corners,(11,11),(-1,-1),criteria)
        imgpoints.append(corners2)

        img = cv2.drawChessboardCorners(img, (6,9), corners2, ret)
        cv2.imshow('img',img)

    ret, cameraMat, distCoeffs, rvecs, tvecs = cv2.calibrateCamera(objpoints, imgpoints, gray.shape[::-1],None,None)

    print(ret, "\n", cameraMat, "\n", distCoeffs, "\n", rvecs, "\n", tvecs)
    cv2.waitKey(0)
    cv2.destroyAllWindows()
基本的にOpenCVのチュートリアルと同じです。
カメラの内部行列と歪み行列は表示するようにしてください。
今回は1枚だけでキャリブレーションをしています。
カメラの内部行列と歪み行列が表示されると思いますので、以下のようにソースコード内にグローバルな変数に宣言しておきます。
cameraMat = np.array([
            [1.38522301e+03, 0.00000000e+00, 9.45366013e+02],
            [0.00000000e+00, 1.37638970e+03, 4.99191837e+02],
            [0.00000000e+00, 0.00000000e+00, 1.00000000e+00],
            ])
distCoeffs = np.array([[-0.28368791, -0.10468215, 0.0078591, -0.00252523, 0.40691145]])
ソースコード内に入力後はキャリブレーションを行う必要はありません。メイン関数からコメントアウトでもしておいてください。
歪み補正
こちらもチュートリアルにありますが、入力画像から歪みを補正する関数を作ります。
def ExecCorrection(img):
    global cameraMat, distCoeffs
    h,  w = img.shape[:2]
    newcameramtx, roi=cv2.getOptimalNewCameraMatrix(cameraMat,distCoeffs,(w,h),1,(w,h))
    dst = cv2.undistort(img, cameraMat, distCoeffs, None, newcameramtx)

    x,y,w,h = roi
    dst = dst[y:y+h, x:x+w]
    return dst
気になる方は画像を表示して補正を確認してください。
AKAZEを使ってどの特徴点がどの位置にずれたかを表示
こちらも下にあるサイトを参考にした部分がほとんどですが。
コード
def AKAZEDiff(img1, img2):
    res = []

    # A-KAZE検出器の生成
    akaze = cv2.AKAZE_create()

    # 特徴量の検出と特徴量ベクトルの計算
    kp1, des1 = akaze.detectAndCompute(img1, None)
    kp2, des2 = akaze.detectAndCompute(img2, None)

    # Brute-Force Matcher生成
    bf = cv2.BFMatcher()

    # 特徴量ベクトル同士をBrute-Force&KNNでマッチング
    matches = bf.knnMatch(des1, des2, k=2)
    good = []

    # データを間引きする
    ratio = 0.5
    for m, n in matches:
        if m.distance < ratio * n.distance:
            good.append([m])

    out = img1

    # 各特徴点のズレに線を引き、その組み合わせをresに格納
    for m in good:
        m = m[0]

        cv2.line(out, (int(kp1[m.queryIdx].pt[0]), int(kp1[m.queryIdx].pt[1])), (int(kp2[m.trainIdx].pt[0]), int(kp2[m.trainIdx].pt[1])), (0, 0, 255), 2)
        res.append(((int(kp1[m.queryIdx].pt[0]), int(kp1[m.queryIdx].pt[1])), (int(kp2[m.trainIdx].pt[0]), int(kp2[m.trainIdx].pt[1]))))
    out = MyResize(out)
    img2 = MyResize(img2)
    out = cv2.addWeighted(src1=out,alpha=0.5,src2=img2,beta=0.5,gamma=0)

    cv2.imshow('img', out)
    return res

# 画像サイズの1辺が1000になるように縮小する
def MyResize(img):
    fixsize = 1000
    h, w, _= img.shape
    print(h, w, fixsize / h, w * fixsize / h)
    hr = h / 1000
    wr = w / 1000

    if hr > wr:
        h = fixsize
        w = w / hr
    else:
        h = h * fixsize / w
        w = fixsize

    img = cv2.resize(img, [int(w), int(h)])
    return img
ここで表示される画像は特徴点が2つの画像間でどこに移動したかを赤い線で示します。MyResizeはちょっと画像が大きかったので付けました。今回は特に必要はないです。
ここで返されている配列は1枚目の画像のどの位置に特徴点があり、2枚目ではその特徴量がどの位置にあるかを格納しています。
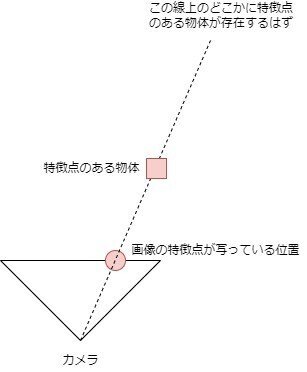
カメラ画像のどの位置に特徴点があるか分かれば、カメラを通るある直線状のどこかに特徴点が存在することが分かります(正確には四角錐だとおもいますが)。

グラフの準備
描画にはmatplotlibを使用します。
コード
def SetGraph():
    global fig, ax
    fig = plt.figure(figsize=(6, 6))
    ax = fig.add_subplot(111, projection='3d')
    fig.add_axes(ax)
ここではグラフの準備だけでプロットはしていません。
figとaxのグローバル変数の宣言をしておいてください。
配列の情報をもとに3次元空間にプロット
1つの特徴点をプロットする関数になります。
コード
# u1,v1は1枚目の画像の特徴点の位置、u2,v2は2枚目の画像の特徴点の位置、
def ScreenToWorld(u1, v1, u2, v2):
    invM = np.linalg.inv(cameraMat)

    # カメラの位置は0.5ずれていて、回転はしていないとする
    tMat = [[0.5], [0], [0]]
    uvMat = [[u1], [v1], [1]]
    worldMat =  np.dot(invM, uvMat) - tMat

    tMat2 = [[0], [0], [0]]
    uvMat2 = [[u2], [v2], [1]]
    worldMat2 =  np.dot(invM, uvMat2) - tMat2

    newPoint = CalcRecentPoints(tMat, worldMat, tMat2, worldMat2)
    PlotGraph(newPoint, "#aa0000")

def PlotGraph(point, color="#0000aa"):
    global ax
    ax.plot(point[0], point[1], point[2], "o", color = color, ms=4, mew=0.5)

def CalcRecentPoints(point1, point2, point3, point4):
    point1 = np.array([point1[0][0], point1[1][0], point1[2][0]])
    point2 = np.array([point2[0][0], point2[1][0], point2[2][0]])
    point3 = np.array([point3[0][0], point3[1][0], point3[2][0]])
    point4 = np.array([point4[0][0], point4[1][0], point4[2][0]])
    n1 = (point2 - point1) / np.linalg.norm(point2 - point1)
    n2 = (point4 - point3) / np.linalg.norm(point4 - point3)

    a1 = n1[0] ** 2  + n1[1] ** 2  + n1[2] ** 2
    a2 = -(n1[0] * n2[0] + n1[1] * n2[1] + n1[2] * n2[2])
    a3 = (point1[0] - point3[0]) * n1[0] + (point1[1] - point3[1]) * n1[1] + (point1[2] - point3[2]) * n1[2]
    b1 = -(n1[0] * n2[0] + n1[1] * n2[1] + n1[2] * n2[2])
    b2 = n2[0] ** 2  + n2[1] ** 2  + n2[2] ** 2
    b3 = (point3[0] - point1[0]) * n2[0] + (point3[1] - point1[1]) * n2[1] + (point3[2] - point1[2]) * n2[2]

    t = (a1 * b3 - a3 * b1) / (a2 * b1 - a1 * b2)
    s = -(a2 * t + a3) / a1

    return (point1 + s * n1 + point3 + t * n2) / 2
2直線が交わる点があればいいのですが、たいていの場合はねじれの関係にあるため、最近点を計算する関数としてCalcRecentPointsがあります。これは参考にしたサイトの式をそのまま使いました。
グラフを表示
コード
def ShowGraph(newPoint = None):

    # 軸ラベル
    ax.set_xlabel('x')
    ax.set_ylabel('y')
    ax.set_zlabel('z')

    # 表示
    plt.show()
一応メイン関数
コード
def main():
    global cameraMat, distCoeffs
    # CalibrateCamera()

    # 画像1
    img1 = cv2.imread(画像のパス)
    img1 = ExecCorrection(img1)
    # 画像2
    img2 = cv2.imread(画像のパス)
    img2 = ExecCorrection(img2)

    sets = AKAZEDiff(img1, img2)
    SetGraph()
    for set in sets:
        ScreenToWorld(set[0][0], set[0][1], set[1][0], set[1][1])

    ShowGraph()
    cv2.destroyAllWindows()
結果
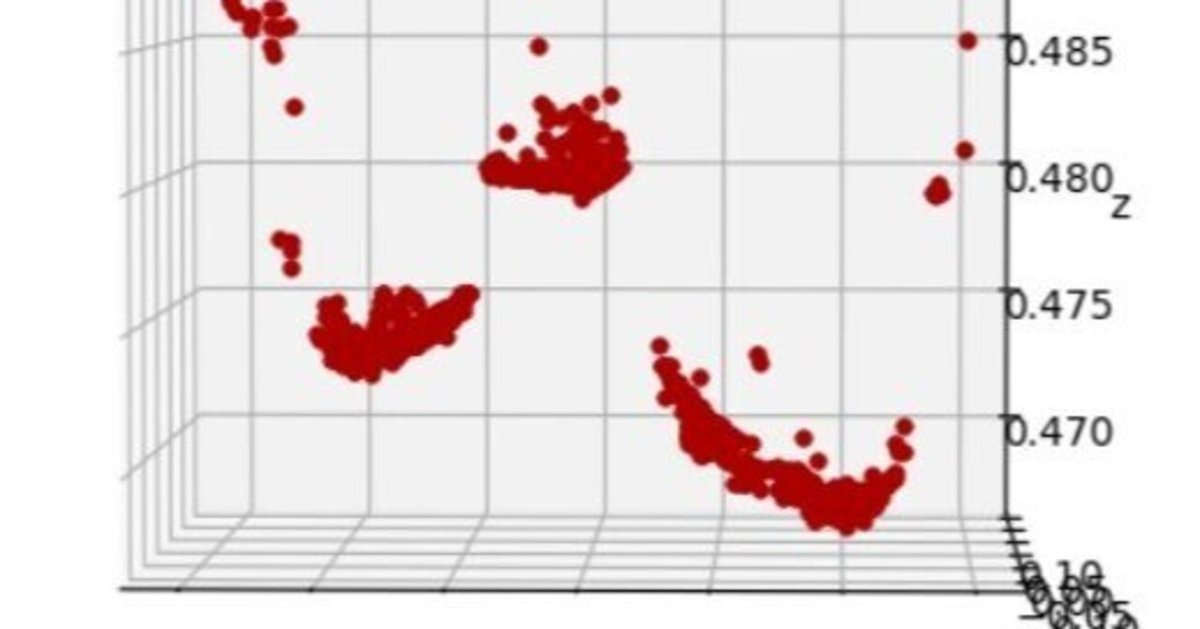
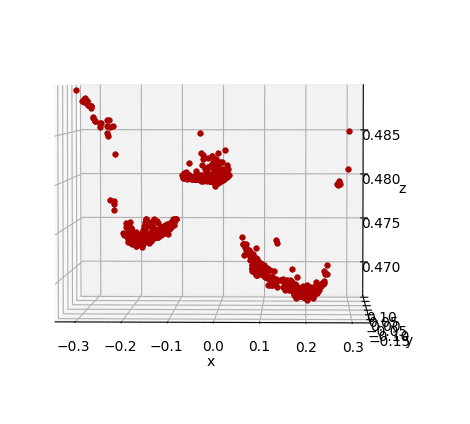
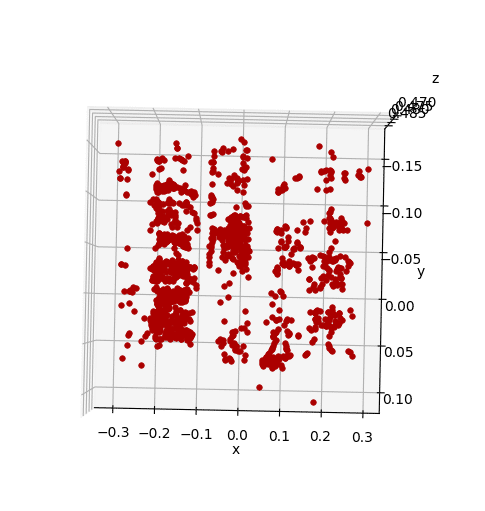
画像を撮った環境は、瓶、ペットボトル、ガムのボトルを前後方向の位置もずらして並べた状態です。z軸の負の方向にカメラがあります。
瓶:x=-0.2
ペットボトル:x=0
ガムのボトル:x=0.2


3つのオブジェクトが存在していることや、前後方向の位置ずれがあることははっきりと分かります。
真ん中にはペットボトルが置いてありましたが、ペットボトルの底にあたる部分は少し精度が悪く見えました。複雑な反射で特徴点ではあるが、似たようなものが多いとこのようになりそうです(もしかすると底の凹凸部分も認識できているかも)。
特徴点のマッチング条件を厳しくしても良さそうです。
また、x=0.2の部分は形がかなり歪んで見えます(本来は円柱)。カメラ位置の小さな回転が近い位置になると大きく響いたかなと感じます。
まとめ
どこにオブジェクトが存在しているかのレベルであれば大体把握できそうでした。細かい値まで設定していないため、距離の測定までは行っていませんがそこそこの精度は出そうです。
動画から連続的に画像を切り出し、複数枚の画像やスマホの重力センサ等を使って行うとより良い結果になりそうですね。
コード全体
from asyncio.windows_events import NULL
from tkinter import Canvas
import cv2
from cv2 import calibrateCamera
import numpy as np
from copy import deepcopy
import matplotlib.pyplot as plt
import glob
from mpl_toolkits.mplot3d import Axes3D

cameraMat = np.array([
            [1.38522301e+03, 0.00000000e+00, 9.45366013e+02],
            [0.00000000e+00, 1.37638970e+03, 4.99191837e+02],
            [0.00000000e+00, 0.00000000e+00, 1.00000000e+00],
            ])
distCoeffs = np.array([[-0.28368791, -0.10468215, 0.0078591, -0.00252523, 0.40691145]])

fig, ax = 0, 0

def main():
    global cameraMat, distCoeffs
    # CalibrateCamera()

    # 画像1
    img1 = cv2.imread(画像のパス)
    img1 = ExecCorrection(img1)
    # 画像2
    img2 = cv2.imread(画像のパス)
    img2 = ExecCorrection(img2)

    sets = AKAZEDiff(img1, img2)
    SetGraph()
    for set in sets:
        ScreenToWorld(set[0][0], set[0][1], set[1][0], set[1][1])

    ShowGraph()
    cv2.destroyAllWindows()

def SetGraph():
    global fig, ax
    fig = plt.figure(figsize=(6, 6))
    ax = fig.add_subplot(111, projection='3d')
    fig.add_axes(ax)

def CalibrateCamera():
    global cameraMat, distCoeffs
    criteria = (cv2.TERM_CRITERIA_EPS + cv2.TERM_CRITERIA_MAX_ITER, 30, 0.001)

    objp = np.zeros((9*6,3), np.float32)
    objp[:,:2] = np.mgrid[0:6,0:9].T.reshape(-1,2)

    objpoints = []
    imgpoints = []

    img = cv2.imread(画像のパス)
    gray = cv2.cvtColor(img,cv2.COLOR_BGR2GRAY)

    ret, corners = cv2.findChessboardCorners(gray, (6,9),None)

    if ret == True:
        objpoints.append(objp)

        corners2 = cv2.cornerSubPix(gray,corners,(11,11),(-1,-1),criteria)
        imgpoints.append(corners2)

        img = cv2.drawChessboardCorners(img, (6,9), corners2, ret)
        cv2.imshow('img',img)

    ret, cameraMat, distCoeffs, rvecs, tvecs = cv2.calibrateCamera(objpoints, imgpoints, gray.shape[::-1],None,None)

    print(ret, "\n", cameraMat, "\n", distCoeffs, "\n", rvecs, "\n", tvecs)
    cv2.waitKey(0)
    cv2.destroyAllWindows()

def ExecCorrection(img):
    global cameraMat, distCoeffs
    h,  w = img.shape[:2]
    newcameramtx, roi=cv2.getOptimalNewCameraMatrix(cameraMat,distCoeffs,(w,h),1,(w,h))
    # undistort
    dst = cv2.undistort(img, cameraMat, distCoeffs, None, newcameramtx)

    # crop the image
    x,y,w,h = roi
    dst = dst[y:y+h, x:x+w]
    return dst

def ScreenToWorld(u1, v1, u2, v2):
    invM = np.linalg.inv(cameraMat)

    tMat = [[0.5], [0], [0]]
    uvMat = [[u1], [v1], [1]]
    worldMat =  np.dot(invM, uvMat) - tMat

    tMat2 = [[0], [0], [0]]
    uvMat2 = [[u2], [v2], [1]]
    worldMat2 =  np.dot(invM, uvMat2) - tMat2

    newPoint = CalcRecentPoints(tMat, worldMat, tMat2, worldMat2)
    PlotGraph(newPoint, "#aa0000")

def PlotGraph(point, color="#0000aa"):
    global ax
    ax.plot(point[0], point[1], point[2], "o", color = color, ms=4, mew=0.5)

def CalcRecentPoints(point1, point2, point3, point4):
    point1 = np.array([point1[0][0], point1[1][0], point1[2][0]])
    point2 = np.array([point2[0][0], point2[1][0], point2[2][0]])
    point3 = np.array([point3[0][0], point3[1][0], point3[2][0]])
    point4 = np.array([point4[0][0], point4[1][0], point4[2][0]])
    n1 = (point2 - point1) / np.linalg.norm(point2 - point1)
    n2 = (point4 - point3) / np.linalg.norm(point4 - point3)

    a1 = n1[0] ** 2  + n1[1] ** 2  + n1[2] ** 2
    a2 = -(n1[0] * n2[0] + n1[1] * n2[1] + n1[2] * n2[2])
    a3 = (point1[0] - point3[0]) * n1[0] + (point1[1] - point3[1]) * n1[1] + (point1[2] - point3[2]) * n1[2]
    b1 = -(n1[0] * n2[0] + n1[1] * n2[1] + n1[2] * n2[2])
    b2 = n2[0] ** 2  + n2[1] ** 2  + n2[2] ** 2
    b3 = (point3[0] - point1[0]) * n2[0] + (point3[1] - point1[1]) * n2[1] + (point3[2] - point1[2]) * n2[2]

    t = (a1 * b3 - a3 * b1) / (a2 * b1 - a1 * b2)
    s = -(a2 * t + a3) / a1

    return (point1 + s * n1 + point3 + t * n2) / 2

def AKAZEDiff(img1, img2):
    res = []

    # A-KAZE検出器の生成
    akaze = cv2.AKAZE_create()

    # 特徴量の検出と特徴量ベクトルの計算
    kp1, des1 = akaze.detectAndCompute(img1, None)
    kp2, des2 = akaze.detectAndCompute(img2, None)

    # Brute-Force Matcher生成
    bf = cv2.BFMatcher()

    # 特徴量ベクトル同士をBrute-Force&KNNでマッチング
    matches = bf.knnMatch(des1, des2, k=2)
    good = []

    # データを間引きする
    ratio = 0.5
    for m, n in matches:
        if m.distance < ratio * n.distance:
            good.append([m])

    out = img1

    for m in good:
        m = m[0]

        cv2.line(out, (int(kp1[m.queryIdx].pt[0]), int(kp1[m.queryIdx].pt[1])), (int(kp2[m.trainIdx].pt[0]), int(kp2[m.trainIdx].pt[1])), (0, 0, 255), 2)
        res.append(((int(kp1[m.queryIdx].pt[0]), int(kp1[m.queryIdx].pt[1])), (int(kp2[m.trainIdx].pt[0]), int(kp2[m.trainIdx].pt[1]))))
    out = MyResize(out)
    img2 = MyResize(img2)
    out = cv2.addWeighted(src1=out,alpha=0.5,src2=img2,beta=0.5,gamma=0)

    cv2.imshow('img', out)
    return res

# 画像サイズの1辺が1000になるように縮小する
def MyResize(img):
    fixsize = 1000
    h, w, _= img.shape
    print(h, w, fixsize / h, w * fixsize / h)
    hr = h / 1000
    wr = w / 1000

    if hr > wr:
        h = fixsize
        w = w / hr
    else:
        h = h * fixsize / w
        w = fixsize

    img = cv2.resize(img, [int(w), int(h)])
    return img

def ShowGraph(newPoint = None):

    # 軸ラベル
    ax.set_xlabel('x')
    ax.set_ylabel('y')
    ax.set_zlabel('z')

    # 表示
    plt.show()


if __name__ == "__main__":
    main()
参考
この記事が気に入ったらサポートをしてみませんか?
