PythonでVCPスクリーニング(続き)

スクリーニング手順
前回のスクリーニング手順から2点追加しました。
yfinance(https://pypi.org/project/yfinance/)で180日間の終値データを収集
Numpyのpolyfitで10次関数に近似
極大値と極小値を順に並べ、それぞれの低下率を取得
2Tをスクリーニング(直近の低下率<直近より一つ前の低下率)
3Tをスクリーニング(直近の低下率<直近より一つ前の低下率<=直近より二つ前の低下率)
2Tもしくは3Tでトレンドテンプレートに該当する銘柄を抽出
(追加)
直近の極大値(凸)は一つ前の極大値から10%以上離れていない
出来高が50日移動平均未満
検証
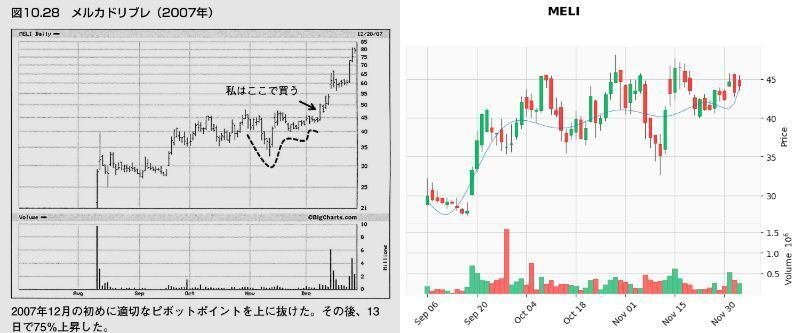
これでどれぐらいVCPパターンを拾えるか、検証のため「ミネルヴィニの成長株投資法 」の中でミネルヴィニ先生がVCPパターンの例で載せているチャートで試してみました。
以下の画像は、「第10章 百聞は一見にしかず」の「ピボットポイント」から「自然な反落とテニスボールの動き」で紹介されたチャートとの比較です。
なお、フォスターウィーラーとバラシスコミュニケーションズは株価データが取得できなかったため比較できませんでした。
また、メルカドリブレはブレイク時にチャートが180日間ないため、90日間のデータとしています。
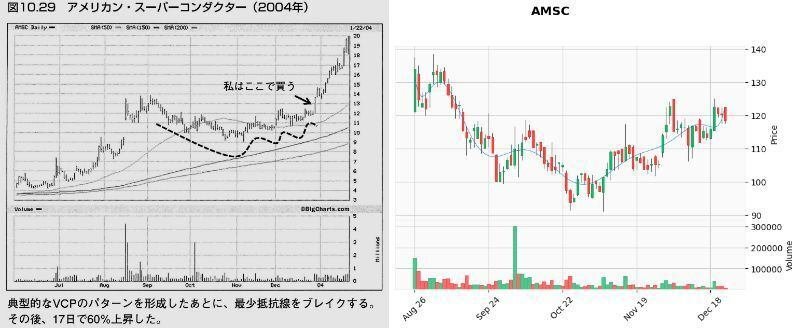
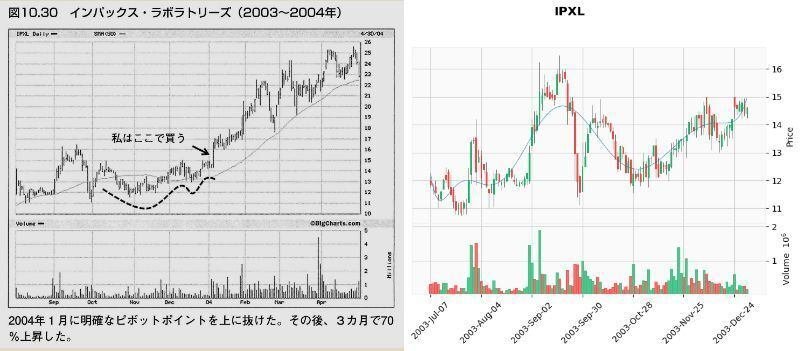
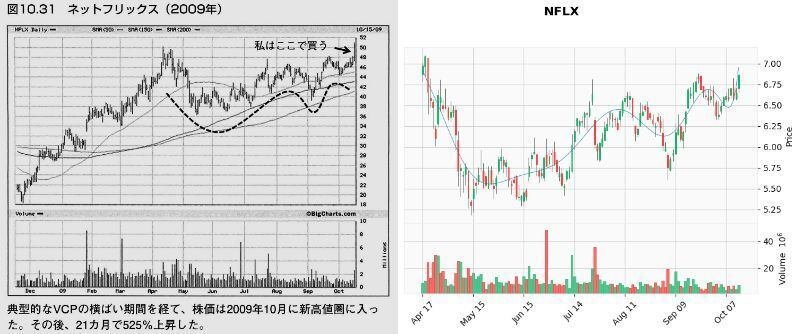
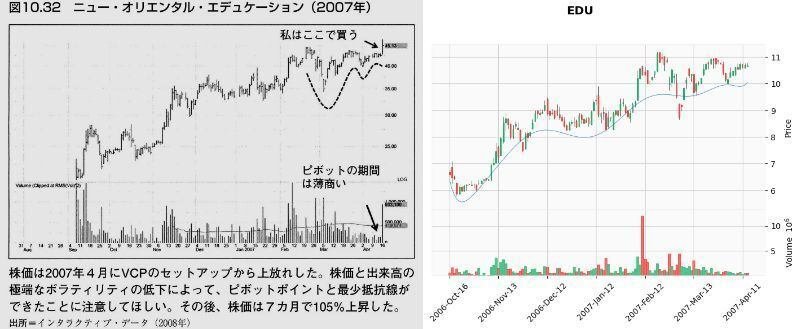
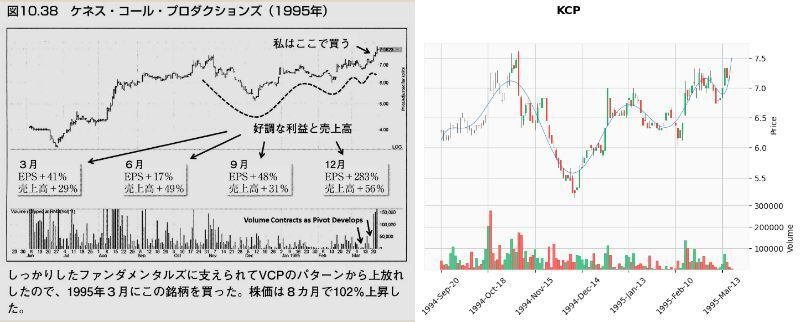
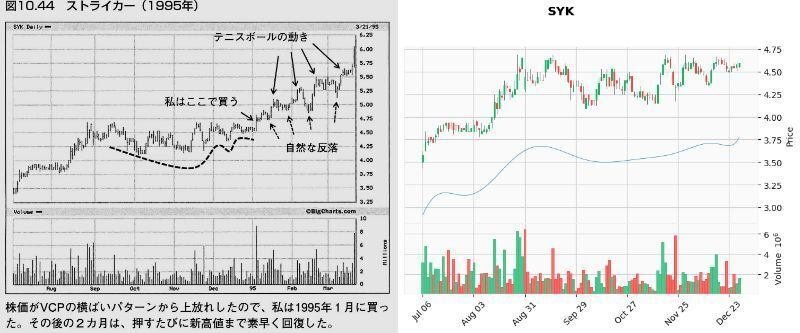
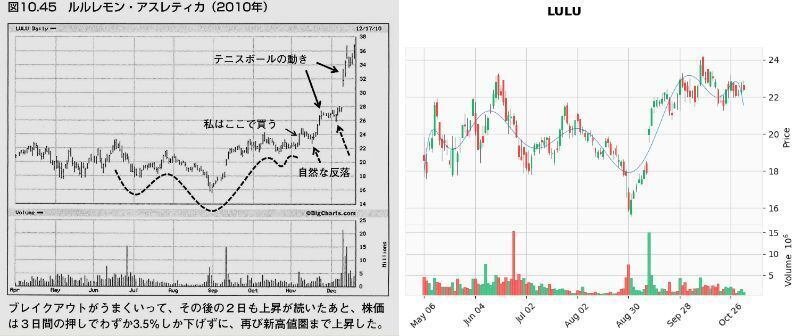
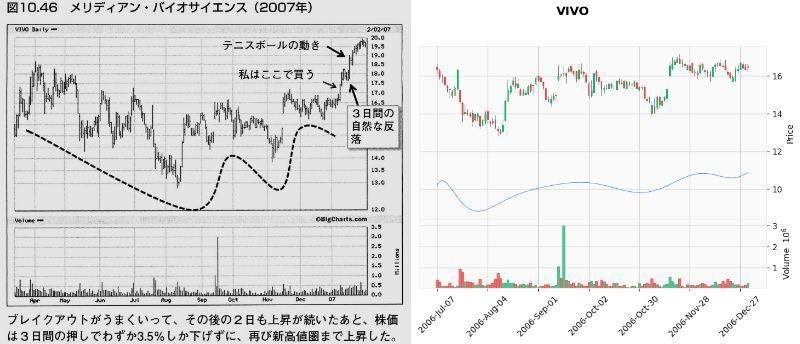
結果
メリディアン・バイオサイエンス(VIVO)が出来高50日移動平均未満をクリアしなかった以外は、VCP判定となりました。(VIVOもチャートのみであればVCP判定)
ミネルヴィニ先生が自著で紹介するぐらい明らかなVCPパターンはほぼ拾えるのではないかと思います。
個人的にはスクリーニングでがっちり絞るよりも、スクリーニングを参考にできるだけチャートを実際に見たいというのと、スクリーニングの基準を厳しくして明らかなVCPパターンを見逃したくないので、これぐらいの基準で運用しようかなと思っています。
(後できるとしたら直近1週間で何%以上変動していないとかかな……、何か思いついたら改修するかもです)
おまけ
更新したスクリーニング手順を反映したコードです。
トレンドテンプレートの判定はしていません。
前回の投稿時にTwitterでみきりさん@mikirisenryoにいただいたアドバイスを受けて、コードの進行とプログレスバーを表示するようにしてみました、みきりさんありがとうございます!
import numpy as np
import pandas as pd
import datetime as dt
from scipy import signal
from tqdm import tqdm

print('株価データ読み込み開始')
df_365d2 = pd.read_excel('365price2.xlsx', header=[0, 1], index_col=0) #Excelから株価情報を取得
df_365d = df_365d2["Adj Close"]
df_365dv = df_365d2["Volume"]
vcp_t2 = []
vcp_t3more = []
ticker_list = list(df_365d.columns.values)

df_180d = df_365d[-180:]

print('株価データ読み込み終了')

#近似値計算--------------------------------------------------------------------------------
print('近似値計算開始')

df_180d['date_no.'] = list(range(len(df_180d),0,-1))
df_app = df_180d.copy()

x = np.array(df_app['date_no.'])

for ticker in tqdm(ticker_list):
    y = np.array(df_app[ticker])
    coe = np.polyfit(x, y, 10) #10次関数に近似
    y3 = np.poly1d(coe)(x)
    df_app[ticker] = y3

for ticker in tqdm(ticker_list):
    maxid = signal.argrelmax(np.array(df_app.loc[:,ticker])) #極大値のindex取得
    minid = signal.argrelmin(np.array(df_app.loc[:,ticker])) #極小値のindex取得

    app_maxlist = df_app.index[maxid[0]] #極大値の日付取得
    app_minlist = df_app.index[minid[0]] #極小値の日付取得

    applist = pd.concat([df_app.loc[app_maxlist,ticker], df_app.loc[app_minlist,ticker]]).sort_index() #極大値と極小値を1つのリストにしてソート

    t_depth = []
    maxima_list = list(df_app.loc[app_maxlist,ticker])

    if len(applist) >= 4: #極値が4以上(2T以上)
        if applist[0] > applist[1]: #最初の極値が極大値の時
            if len(applist) % 2 == 1: #極値の数が奇数の時
                for i in range(0, len(applist)-1, 2):
                    t_depth.append(( applist[i + 1] - applist[i] ) * -100 / applist[i])
            else:
                for i in range(0, len(applist), 2):
                    t_depth.append(( applist[i + 1] - applist[i] ) * -100 / applist[i])

        else:
            if len(applist) % 2 == 0:
                for i in range(1, len(applist)-1, 2):
                    t_depth.append(( applist[i + 1] - applist[i] ) * -100 / applist[i])
            else:
                for i in range(1, len(applist), 2):
                    t_depth.append(( applist[i + 1] - applist[i] ) * -100 / applist[i])


        if (1 < len(t_depth) <= 2) and (t_depth[-1] < 5) and (maxima_list[-1] * 0.9 <= maxima_list[-2] <= maxima_list[-1] * 1.1):
            if t_depth[-1] < t_depth[-2]:
                vcp_t2.append(ticker)
        elif (len(t_depth) > 2) and (t_depth[-1] < 10) and (maxima_list[-1] * 0.9 <= maxima_list[-2] <= maxima_list[-1] * 1.1):
            if t_depth[-1] < t_depth[-2] <= t_depth[-3]:
                vcp_t3more.append(ticker)
            elif (t_depth[-1] < t_depth[-2]) and (t_depth[-2] > t_depth[-3]):
                vcp_t2.append(ticker)
print('近似値計算終了')

#出来高判定--------------------------------------------------------------------------------------
print('出来高判定開始')

df_365dv.loc['50ma',:] = list(df_365dv.rolling(50).mean().iloc[-1,:])
v_underave_list = df_365dv.columns[df_365dv.iloc[-1,:] > df_365dv.iloc[-2,:]].tolist() #直近出来高が50日平均未満

print('出来高判定終了')

print('VCP出力')
tt_vcpt2 = list(set(vcp_t2) & set(v_underave_list))
tt_vcpt3more = list(set(vcp_t3more) & set(v_underave_list))
tt_vcpt2.sort()
tt_vcpt3more.sort()
print(tt_vcpt2)
print(tt_vcpt3more)
おまけ2
週足での判定も載せておきます。ほとんど同じですが……
import numpy as np
import pandas as pd
import datetime as dt
from scipy import signal
from tqdm import tqdm

print('株価データ読み込み開始')
df_365d2 = pd.read_excel('365price2.xlsx', header=[0, 1], index_col=0) #Excelから株価情報を取得
df_365d = df_365d2["Adj Close"]
df_365dw = df_365d2["Adj Close"].resample("W").agg('last')
df_365dv = df_365d2["Volume"].resample("W").agg('sum')
vcp_t2 = []
vcp_t3more = []
ticker_list = list(df_365d.columns.values)

print('株価データ読み込み終了')

#近似値計算--------------------------------------------------------------------------------
print('近似値計算開始')
df_365dw['date_no.'] = list(range(len(df_365dw),0,-1))
df_app = df_365dw.copy()

x = np.array(df_app['date_no.'])

for ticker in tqdm(ticker_list):
    y = np.array(df_app[ticker])
    coe = np.polyfit(x, y, 10) #10次関数に近似
    y3 = np.poly1d(coe)(x)
    df_app[ticker] = y3

for ticker in tqdm(ticker_list):
    maxid = signal.argrelmax(np.array(df_app.loc[:,ticker])) #極大値のindex取得
    minid = signal.argrelmin(np.array(df_app.loc[:,ticker])) #極小値のindex取得

    app_maxlist = df_app.index[maxid[0]] #極大値の日付取得
    app_minlist = df_app.index[minid[0]] #極小値の日付取得

    applist = pd.concat([df_app.loc[app_maxlist,ticker], df_app.loc[app_minlist,ticker]]).sort_index() #極大値と極小値を1つのリストにしてソート

    t_depth = []
    maxima_list = list(df_app.loc[app_maxlist,ticker])

    if len(applist) >= 4: #極値が4以上(2T以上)
        if applist[0] > applist[1]: #最初の極値が極大値の時
            if len(applist) % 2 == 1: #極値の数が奇数の時
                for i in range(0, len(applist)-1, 2):
                    t_depth.append(( applist[i + 1] - applist[i] ) * -100 / applist[i])
            else:
                for i in range(0, len(applist), 2):
                    t_depth.append(( applist[i + 1] - applist[i] ) * -100 / applist[i])

        else:
            if len(applist) % 2 == 0:
                for i in range(1, len(applist)-1, 2):
                    t_depth.append(( applist[i + 1] - applist[i] ) * -100 / applist[i])
            else:
                for i in range(1, len(applist), 2):
                    t_depth.append(( applist[i + 1] - applist[i] ) * -100 / applist[i])


        if (1 < len(t_depth) <= 2) and (t_depth[-1] < 5) and (maxima_list[-1] * 0.9 <= maxima_list[-2] <= maxima_list[-1] * 1.1):
            if t_depth[-1] < t_depth[-2]:
                vcp_t2.append(ticker)
        elif (len(t_depth) > 2) and (t_depth[-1] < 10) and (maxima_list[-1] * 0.9 <= maxima_list[-2] <= maxima_list[-1] * 1.1):
            if t_depth[-1] < t_depth[-2] <= t_depth[-3]:
                vcp_t3more.append(ticker)
            elif (t_depth[-1] < t_depth[-2]) and (t_depth[-2] > t_depth[-3]):
                vcp_t2.append(ticker)
print('近似値計算終了')

#出来高判定--------------------------------------------------------------------------------------
print('出来高判定開始')

df_365dv.loc['10wma',:] = list(df_365dv.rolling(10).mean().iloc[-1,:])
v_underave_list = df_365dv.columns[df_365dv.iloc[-1,:] > df_365dv.iloc[-2,:]].tolist() #直近出来高が50日平均未満

print('出来高判定終了')

tt_vcpt2 = list(set(vcp_t2) & set(v_underave_list))
tt_vcpt3more = list(set(vcp_t3more)& set(v_underave_list))
tt_vcpt2.sort()
tt_vcpt3more.sort()
print(tt_vcpt2)
print(tt_vcpt3more)