
Google Colab で SAM 2 を試す

「Google Colab」で「SAM 2」を試したのでまとめました。
1. SAM 2
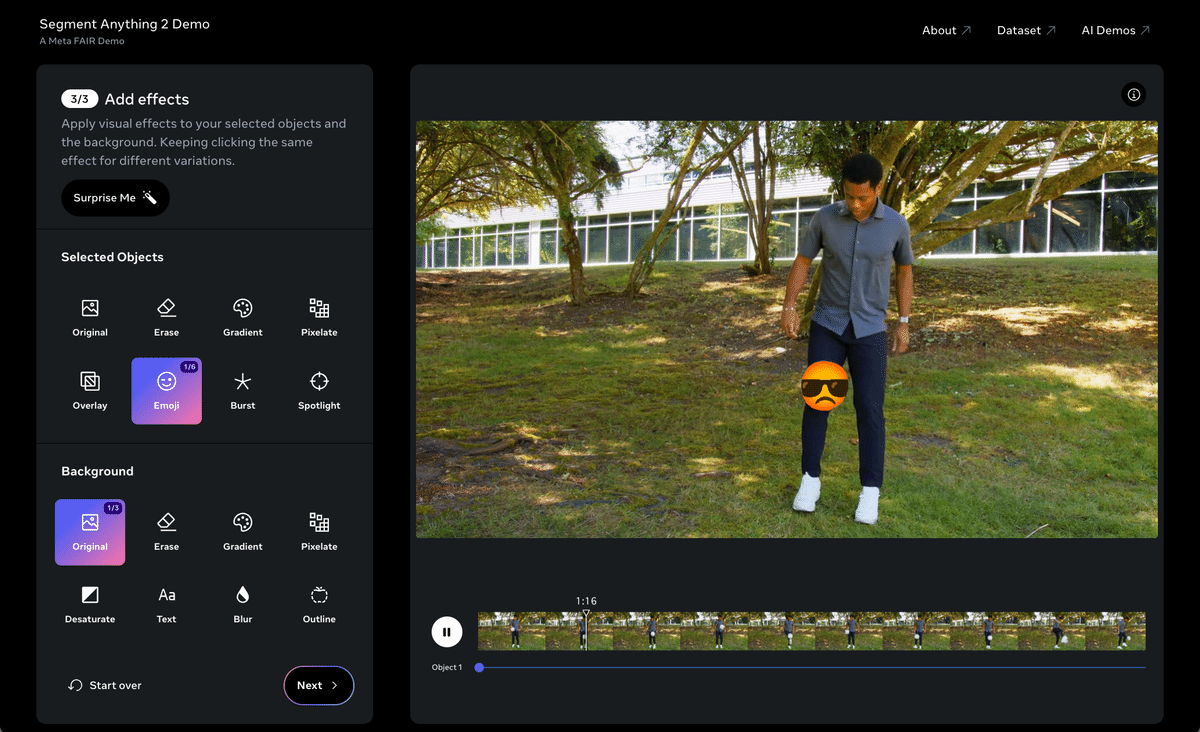
「SAM 2」(Segment Anything Model 2) は、画像や動画のセグメンテーションを行うためのAIモデルです。目的のオブジェクトを示す情報 (XY座標など) が与えられた場合に、オブジェクトマスクを予測します。
具体的に何ができるかは、以下のデモページが参考になります。
2. セットアップ
セットアップの手順は、次のとおりです。
(1) パッケージのインストール。
# パッケージのインストール
!git clone https://github.com/facebookresearch/segment-anything-2.git
%cd ./segment-anything-2
!pip install -e .
(2) チェックポイントのダウンロード。
# チェックポイントのダウンロード
%cd checkpoints
!./download_ckpts.sh
%cd ..・sam2_hiera_tiny.pt
・sam2_hiera_small.pt
・sam2_hiera_base_plus.pt
・sam2_hiera_large.pt
3. 画像のセグメンテーション
画像のセグメンテーションの手順は、次のとおりです。
(1) 左端のフォルダアイコンで、画像を「segment-anything-2」フォルダにアップロード。
・sample.jpg

(2) 画像の準備。
from PIL import Image
import numpy as np

# 画像の準備
image = Image.open("sample.jpg")
image = np.array(image.convert("RGB"))
(3) ユーティリティ関数の準備。
画像上にに各種情報を表示する関数になります。
# マスクの表示
def show_mask(mask, ax, random_color=False, borders = True):
    if random_color:
        color = np.concatenate([np.random.random(3), np.array([0.6])], axis=0)
    else:
        color = np.array([30/255, 144/255, 255/255, 0.6])
    h, w = mask.shape[-2:]
    mask = mask.astype(np.uint8)
    mask_image =  mask.reshape(h, w, 1) * color.reshape(1, 1, -1)
    if borders:
        import cv2
        contours, _ = cv2.findContours(mask,cv2.RETR_EXTERNAL, cv2.CHAIN_APPROX_NONE)
        # Try to smooth contours
        contours = [cv2.approxPolyDP(contour, epsilon=0.01, closed=True) for contour in contours]
        mask_image = cv2.drawContours(mask_image, contours, -1, (1, 1, 1, 0.5), thickness=2)
    ax.imshow(mask_image)

# 点群の表示
def show_points(coords, labels, ax, marker_size=375):
    pos_points = coords[labels==1]
    neg_points = coords[labels==0]
    ax.scatter(pos_points[:, 0], pos_points[:, 1], color='green', marker='*', s=marker_size, edgecolor='white', linewidth=1.25)
    ax.scatter(neg_points[:, 0], neg_points[:, 1], color='red', marker='*', s=marker_size, edgecolor='white', linewidth=1.25)

# ボックスの表示
def show_box(box, ax):
    x0, y0 = box[0], box[1]
    w, h = box[2] - box[0], box[3] - box[1]
    ax.add_patch(plt.Rectangle((x0, y0), w, h, edgecolor='green', facecolor=(0, 0, 0, 0), lw=2))

# マスク群の表示
def show_masks(image, masks, scores, point_coords=None, box_coords=None, input_labels=None, borders=True):
    for i, (mask, score) in enumerate(zip(masks, scores)):
        plt.figure(figsize=(10, 10))
        plt.imshow(image)
        show_mask(mask, plt.gca(), borders=borders)
        if point_coords is not None:
            assert input_labels is not None
            show_points(point_coords, input_labels, plt.gca())
        if box_coords is not None:
            # boxes
            show_box(box_coords, plt.gca())
        if len(scores) > 1:
            plt.title(f"Mask {i+1}, Score: {score:.3f}", fontsize=18)
        plt.axis('off')
        plt.show()
(4) Predictorの準備。
from sam2.build_sam import build_sam2
from sam2.sam2_image_predictor import SAM2ImagePredictor

# Predictorの準備
checkpoint = "./checkpoints/sam2_hiera_large.pt"
model_cfg = "sam2_hiera_l.yaml"
predictor = SAM2ImagePredictor(build_sam2(model_cfg, checkpoint))
(5) Predictorに画像を指定。
SAM2ImagePredictor.set_image()で画像を指定します。
# Predictorに画像を指定
predictor.set_image(image)
(6) 目的のオブジェクトの指定。
目的のオブジェクト上の位置 (x, y) と、ラベル (1: 前景点、0:背景点) を選択します。
# 目的のオブジェクトの指定
input_point = np.array([[500, 300]])  # 位置
input_label = np.array([1])  # ラベル (1:前景点、0:背景点)
(7) 目的のオブジェクトの確認。
☆で位置が示されます。
import matplotlib.pyplot as plt

# 目的のオブジェクトの確認
plt.figure(figsize=(10, 10))
plt.imshow(image)
show_points(input_point, input_label, plt.gca())
plt.axis('on')
plt.show()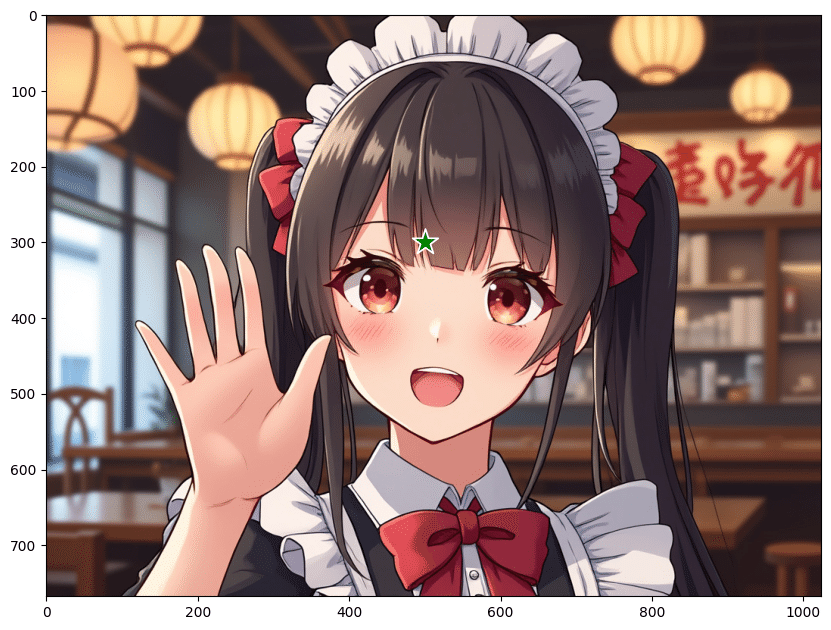
(8) Predictorで予測。
# Predictorで予測
masks, scores, logits = predictor.predict(
point_coords=input_point,
point_labels=input_label,
multimask_output=True,
)
sorted_ind = np.argsort(scores)[::-1]
masks = masks[sorted_ind] # マスク
scores = scores[sorted_ind] # スコア
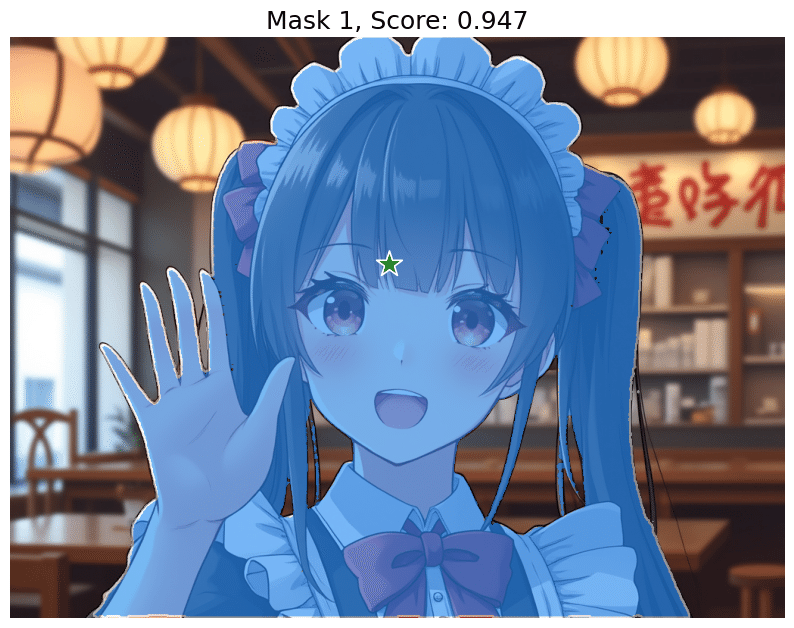
logits = logits[sorted_ind] # ロジットmultimask_output=True (デフォルト) の場合、3つのマスクを出力します。スコアはマスクの品質の推定値です。単一のポイントなど、あいまいなプロンプトの場合、単一のマスクのみが必要な場合でも、multimask_output=True を使用することが推奨されます。
(9) マスクの確認。
# マスクの確認
show_masks(image, masks, scores,
    point_coords=input_point,
    input_labels=input_label,
    borders=True
)
4. 動画のセグメンテーション
動画のセグメンテーションの手順は、次のとおりです。
(1) 左端のフォルダアイコンで、動画を「segment-anything-2」フォルダにアップロード。
・sample.mp4
(2) 動画をJPEGフレームのリストに変換。
「videos」フォルダに00000.jpg〜00089.jpgが生成されます。
# 動画をJPEGフレームのリストに変換
!mkdir videos
!ffmpeg -i sample.mp4 -q:v 2 -start_number 0 ./videos/'%05d.jpg'
(3) JPEGフレーム名の準備
import os

# JPEGフレーム名の準備
video_dir = "./videos"
frame_names = [
    p for p in os.listdir(video_dir)
    if os.path.splitext(p)[-1] in [".jpg", ".jpeg", ".JPG", ".JPEG"]
]
frame_names.sort(key=lambda p: int(os.path.splitext(p)[0]))
(4) ユーティリティ関数の準備。
画像上にに各種情報を表示する関数になります。
# マスクの表示
def show_mask(mask, ax, obj_id=None, random_color=False):
    if random_color:
        color = np.concatenate([np.random.random(3), np.array([0.6])], axis=0)
    else:
        cmap = plt.get_cmap("tab10")
        cmap_idx = 0 if obj_id is None else obj_id
        color = np.array([*cmap(cmap_idx)[:3], 0.6])
    h, w = mask.shape[-2:]
    mask_image = mask.reshape(h, w, 1) * color.reshape(1, 1, -1)
    ax.imshow(mask_image)

# 点群の表示
def show_points(coords, labels, ax, marker_size=200):
    pos_points = coords[labels==1]
    neg_points = coords[labels==0]
    ax.scatter(pos_points[:, 0], pos_points[:, 1], color='green', marker='*', s=marker_size, edgecolor='white', linewidth=1.25)
    ax.scatter(neg_points[:, 0], neg_points[:, 1], color='red', marker='*', s=marker_size, edgecolor='white', linewidth=1.25)

# ボックスの表示
def show_box(box, ax):
    x0, y0 = box[0], box[1]
    w, h = box[2] - box[0], box[3] - box[1]
    ax.add_patch(plt.Rectangle((x0, y0), w, h, edgecolor='green', facecolor=(0, 0, 0, 0), lw=2))
(5) Predictorの準備。
from sam2.build_sam import build_sam2_video_predictor

# Predictorの準備
sam2_checkpoint = "./checkpoints/sam2_hiera_large.pt"
model_cfg = "sam2_hiera_l.yaml"
predictor = build_sam2_video_predictor(model_cfg, sam2_checkpoint)
(6) 動画の推論状態の初期化。
「SAM 2」では、インタラクティブな動画セグメンテーションにステートフル推論が必要なため、動画の推論状態を初期化する必要があります。
# 動画の推論状態の初期化
inference_state = predictor.init_state(video_path=video_dir)
(7) 動画の推論状態のリセット。
このinference_stateを使用してトラッキングを実行した場合、reset_state でリセットする必要があります。
# 動画の推論状態のリセット
predictor.reset_state(inference_state)
(8) 目的のオブジェクトの指定。
import numpy as np

# 目的のオブジェクトの指定
ann_frame_idx = 0
ann_obj_id = 1
input_point = np.array([[800, 400]], dtype=np.float32) # 位置
input_label = np.array([1], np.int32) # ラベル (1:前景点、0:背景点)
(9) 指定フレームをPredictorで予測。
import cv2
import matplotlib.pyplot as plt

# 指定フレームをPredictorで予測
_, out_obj_ids, out_mask_logits = predictor.add_new_points(
    inference_state=inference_state,
    frame_idx=ann_frame_idx,
    obj_id=ann_obj_id,
    points=input_point,
    labels=input_label,
)

# 確認
plt.figure(figsize=(12, 8))
plt.title(f"frame {ann_frame_idx}")
image = cv2.imread(video_dir + "/" + frame_names[ann_frame_idx])
image = cv2.cvtColor(image, cv2.COLOR_BGR2RGB)
plt.imshow(image)
show_points(input_point, input_label, plt.gca())
show_mask((out_mask_logits[0] > 0.0).cpu().numpy(), plt.gca(), obj_id=out_obj_ids[0])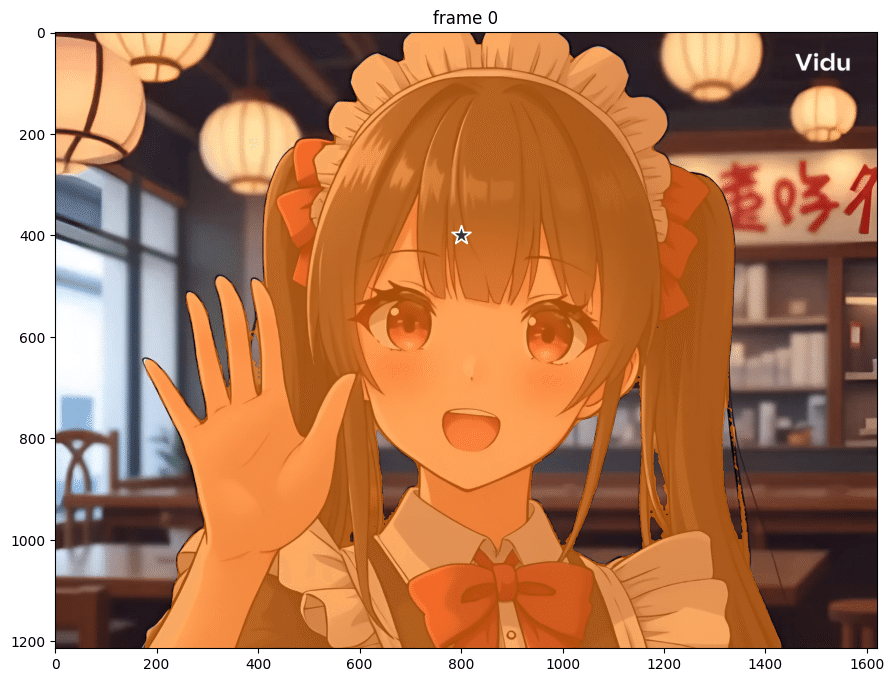
(10) 全フレームをPredictorで予測。
# 全フレームをPredictorで予測
video_segments = {}
for out_frame_idx, out_obj_ids, out_mask_logits in predictor.propagate_in_video(inference_state):
    video_segments[out_frame_idx] = {
        out_obj_id: (out_mask_logits[i] > 0.0).cpu().numpy()
        for i, out_obj_id in enumerate(out_obj_ids)
    }
(11) 結果画像フレームの保存。
「output」フォルダに00000.jpg〜00089.jpgが保存されます。
!mkdir output

# 結果画像フレームの保存
plt.close("all")
for out_frame_idx in range(len(frame_names)):
    plt.figure(figsize=(6, 4))
    plt.title(f"frame {out_frame_idx}")
    plt.axis("off")
    plt.tight_layout(pad=0)

    # 元画像の描画
    image = cv2.imread(video_dir + "/" + frame_names[out_frame_idx])
    image = cv2.cvtColor(image, cv2.COLOR_BGR2RGB)
    plt.imshow(image)

    # マスクの描画
    for out_obj_id, out_mask in video_segments[out_frame_idx].items():
        show_mask(out_mask, plt.gca(), obj_id=out_obj_id)

    # 結果画像フレームの保存
    basename = os.path.basename(frame_names[out_frame_idx])
    output_frame = os.path.join("output", basename)
    plt.savefig(output_frame)
    plt.close()
(12) 結果画像フレームを動画に変換。
# 結果画像フレームを動画に変換
!ffmpeg -framerate 24 -i ./output/%05d.jpg -c:v libx264 -r 30 -pix_fmt yuv420p ./output.mp4
動画のセグメンテーション pic.twitter.com/oJlarPsBAk
— 布留川英一 / Hidekazu Furukawa (@npaka123) August 16, 2024
この記事が気に入ったらサポートをしてみませんか?