
【Python】ツイートの感情を分析する🐥

↓のnoteで「ツイートの感情分析」をしました。
※「【メインディッシュ②🍣】ツイートの感情分析やってみた」の章
このnoteで行った「ツイートから6つの感情」を抽出するやり方です。
コチラがお分かりになる方はご自分でできると思います。
勿体無いので買わずに、ファミマでファミチキでも食べてください🍗
◆分析するときの環境
いつものJupyter Notebookです。
◆使用するデータ
「安部首相の2016-2017」のツイートのデータです。
このデータを活用して「どんな感情のツイートが多いか」を分析することができます。
怒り、嫌悪、恐怖、幸福、悲しみ、驚き

ほな、行きます。
◆サクッと前処理から🐱
元データが、少々扱いづらいので綺麗に整理します。
以下を、順にコピペすれば前処理が完了します。
※ディレクトリ名はご自身のをお入れください
 #データの取り込み
df = pd.read_csv("/xxxxx/Shinzo Abe Tweet 20171024 - Tweet.csv")
 #データの確認
df.head()
#扱いやすいように列名を一部変えます df.rename(columns= lambda x : str(x).replace(" ","_"),inplace=True)
#Profile_Tweet_1(=replies)の列を扱いやすいように加工
df.Profile_Tweet_1 = df.Profile_Tweet_1.map(lambda x :str(x).replace(" replies",""))
df.Profile_Tweet_1 = df.Profile_Tweet_1.map(lambda x :str(x).replace(",",""))
df.Profile_Tweet_1 = df.Profile_Tweet_1.astype("int")
#Profile_Tweet_2(=retweets)の列を扱いやすいように加工
df.Profile_Tweet_2 = df.Profile_Tweet_2.map(lambda x :str(x).replace(" retweets",""))
df.Profile_Tweet_2 = df.Profile_Tweet_2.map(lambda x :str(x).replace(",",""))
df.Profile_Tweet_2 = df.Profile_Tweet_2.astype("int")
#Profile_Tweet_3(=likes)の列を扱いやすいように加工
df.Profile_Tweet_3 = df.Profile_Tweet_3.map(lambda x :str(x).replace(" likes",""))
df.Profile_Tweet_3 = df.Profile_Tweet_3.map(lambda x :str(x).replace(",",""))
df.Profile_Tweet_3 = df.Profile_Tweet_3.astype("int")
#列名をわかりやすいように変更
df.rename(columns={
"Profile_Tweet_1":"replies",
"Profile_Tweet_2":"retweets",
"Profile_Tweet_3":"likes"
}, inplace = True)
#不要になった列を削除 #"Reply", "Re_Tweet","Like"列は意味が重複するので削除
df.drop(["Reply", "Re_Tweet","Like"], axis=1, inplace=True) #不要なデータがないか確認
df.Full_Name_Show.unique()

安倍首相以外のデータが入っていそうなので、↓で消します。
 #安倍首相のツイートのみ抽出
df = df[df.Full_Name_Show == "安倍晋三"]
#Tweet_Nav列をdate列に変更
tweet_date = df.Tweet_Nav.str.split(" ",expand=True)
tweet_date.columns = ["month","day","year"]
tweet_date.head() #確認
for i in tweet_date.columns:
print(i)
print(tweet_date[i].unique())
確認すると、
1、year列に2016しかなかった(空欄になっている)ので、"2017"の文字列を空欄に追加します(元データから確認すると2017年にツイートされてたため)
2、month列とday列がごっちゃになっているので整頓します(2016分がずれている)
#①year列に2016しかなく、2017の文字列を追加します
tweet_date.year.fillna("2017", inplace=True)
#②2016年と2017年でmonthとdayがずれてる(2016年分がずれてる)ので加工
#まず 、一旦2016と2017にそれぞれ分けます
year_2016 = tweet_date[tweet_date.year == "2016"]
year_2017 = tweet_date[tweet_date.year == "2017"]
#2016年の方をmonthとdayの列名を変更
year_2016.rename(columns={
"month":"day",
"day":"month"},inplace = True)
##2017のデータに2016を縦につなげる
tweet_date = pd.concat([year_2017,year_2016],axis=0)
#元のデータフレームにくっつける
df = pd.concat([df,tweet_date],axis=1)
#確認
df.head()datetimeで扱いやすいようにあと少しだけ加工します
#アルファベットの月名を数字に変更
df["month_int"] = df.month.replace({
'Oct':10,
'Sep':9,
'Feb':2,
'Dec':12,
'Nov':11,
'Jul':7,
'Jun':6,
'Apr':4,
'Mar':3})
#年月日に
df["tweet_date"] = df.day + "/" + df.month + "/" + df.year
#datetimeの型に
df.tweet_date = pd.to_datetime(df.tweet_date)
#いらない列を決しておく
df.drop(["day","month","year","month_int"], axis=1, inplace=True)そうすると、ツイート日がdatetime型になり、indexに指定したりすることで、扱いやすくなります。
 #データの型の確認
df.dtypes
#「tweet_date」の列がdatetime64になってることが確認できます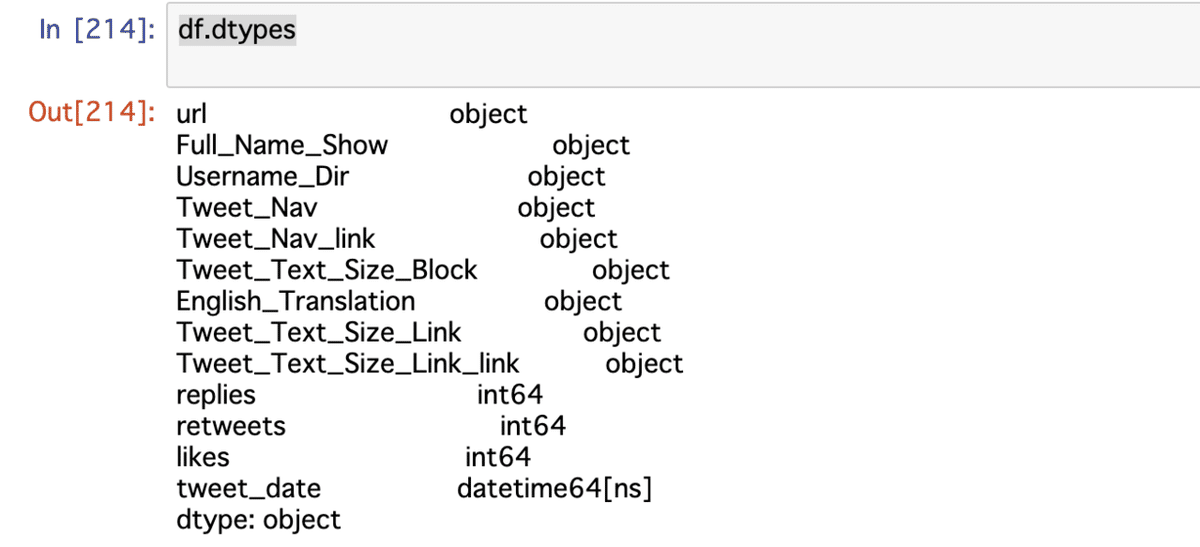
例えば、下記のようにすると年、四半期、月、日をindexにできるので集計がしやすくなります。
 #index列を指定 df = df.set_index("tweet_date")

 #マルチインデックスでdfに複数のindex情報をセットすると色々集計しやすい  #年月別ツイート数 df_yqmd = df.set_index([
   df.index.year,
   df.index.quarter,
   df.index.month,
   df.index.day,
   df.index.weekday_name])

#index名を設定
df_yqmd.index.names = ["year","quarter","month","day","day_of_week"]
【参考】
・年月別集計ができたり

・曜日別の集計ができたり

長くなりましたが、ここまでで前処理が終わり、データフレーム が出来上がりました。
◆感情分析スタート🦁
・使用するライブラリのインポート
Jupyter Notebookでそのまま以下を実行してください。
 #githubから 、ライブラリをコピー(インストール)
! git clone https://github.com/sugiyamath/sentiment_ja
#セットアップ
! python setup.py install
貴重なお時間で読んでいただいてありがとうございます。 感謝の気持ちで、いっPython💕