Python データの可視化 COVID-19の巻 世界編
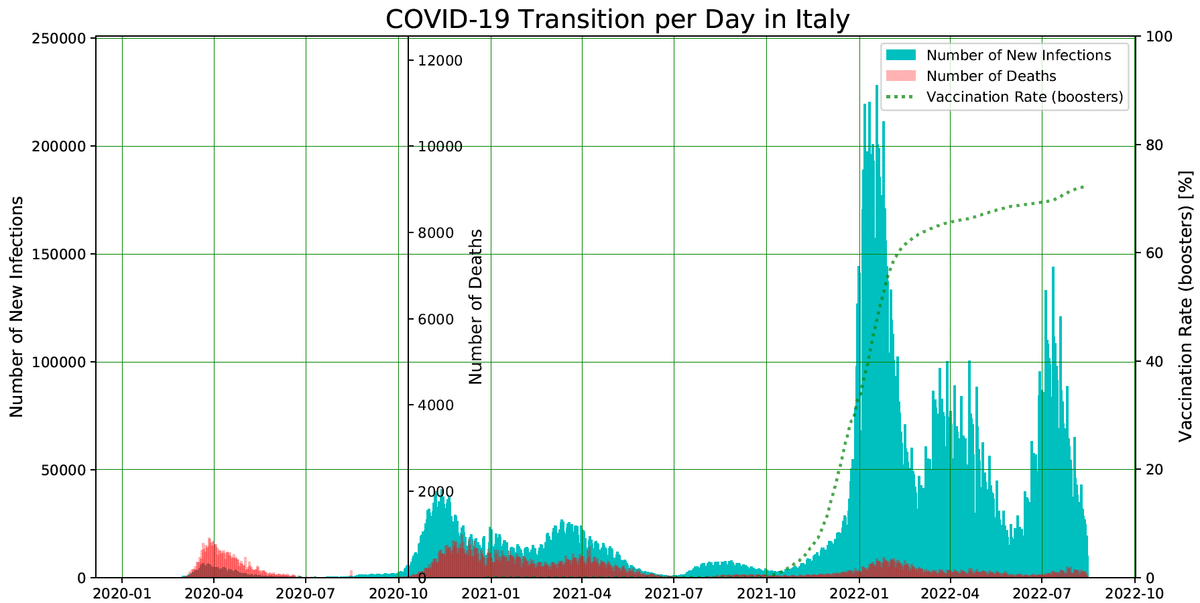
オープンデータを用いて世界各国のコロナ感染者数、死者数、ワクチン接種率をグラフ化する。今回は国ごとにページ分けして、pdf形式での出力する。
アウトプット

完成するファイルはリスト化されている国すべてのグラフだが、主要国のみを抜粋したアウトプットファイルを貼る。
データの出典
データはThe Humanitarian Data Exchangeの以下のデータを用いた。
感染データ:https://data.humdata.org/dataset/novel-coronavirus-2019-ncov-cases
ワクチン接種:https://data.humdata.org/dataset/covid-19-vaccinations
モジュールのimport
import numpy as np
import pandas as pd
import matplotlib.pyplot as plt
import matplotlib.ticker as ticker
import os
import datetime
import urllib.request
from matplotlib.backends.backend_pdf import PdfPages
# 画像大量作成するときにメモリ消費が激しくなるため、以下をおまじないとして入れておく
import matplotlib
matplotlib.interactive(False)
データ読み込み
感染者数データ
url_infected = "https://data.humdata.org/hxlproxy/api/data-preview.csv?url=https%3A%2F%2Fraw.githubusercontent.com%2FCSSEGISandData%2FCOVID-19%2Fmaster%2Fcsse_covid_19_data%2Fcsse_covid_19_time_series%2Ftime_series_covid19_confirmed_global.csv&filename=time_series_covid19_confirmed_global.csv"
df_infected = pd.read_csv(url_infected)
df_infected = df_infected.drop('Province/State', axis=1) #一列目削除
df_infected['Country/Region'] = df_infected['Country/Region'].str.strip('*') #*がついていると後々コケるので、事前に削除(データのクレンジング)
list_infected_country = df_infected['Country/Region'].unique().tolist() #国名の抽出、リスト化
urllib.request.urlretrieve(url_infected, url_infected.split("=")[-1]) #フォルダにファイルをダウンロード
死亡者数データ
url_death = "https://data.humdata.org/hxlproxy/api/data-preview.csv?url=https%3A%2F%2Fraw.githubusercontent.com%2FCSSEGISandData%2FCOVID-19%2Fmaster%2Fcsse_covid_19_data%2Fcsse_covid_19_time_series%2Ftime_series_covid19_deaths_global.csv&filename=time_series_covid19_deaths_global.csv"
df_death = pd.read_csv(url_death)
df_death = df_death.drop('Province/State', axis=1) #一列目削除
df_death['Country/Region'] = df_death['Country/Region'].str.strip('*')
list_country_death = df_death['Country/Region'].unique().tolist()
urllib.request.urlretrieve(url_death, url_death.split("=")[-1])
ワクチン接種率データ
url_vaccine = "https://proxy.hxlstandard.org/data.csv?tagger-match-all=on&tagger-01-header=location&tagger-01-tag=%23country%2Bname&tagger-02-header=iso_code&tagger-02-tag=%23country%2Bcode&tagger-03-header=date&tagger-03-tag=%23date&tagger-04-header=total_vaccinations&tagger-04-tag=%23total%2Bvaccinations&tagger-08-header=daily_vaccinations&tagger-08-tag=%23total%2Bvaccinations%2Bdaily&url=https%3A%2F%2Fraw.githubusercontent.com%2Fowid%2Fcovid-19-data%2Fmaster%2Fpublic%2Fdata%2Fvaccinations%2Fvaccinations.csv&header-row=1&dest=data_view"
df_vaccine = pd.read_csv(url_vaccine)
df_vaccine = df_vaccine.drop(0, axis=0) #一列目削除
df_vaccine['location'] = df_vaccine['location'].str.replace('United States', 'US') #アメリカの表記を合わせる
list_country_vaccine = df_vaccine['location'].unique().tolist() #ユニークな国名の抽出、リスト化
urllib.request.urlretrieve(url_vaccine, "vaccine_data.csv") #フォルダにファイルをダウンロード
グラフ作成
# それぞれのデータで存在するユニークな国名を抽出する。
list_country_unique = list(set(list_infected_country) & set(list_country_vaccine) & set(list_country_death))

pdf = PdfPages('world_graph_page.pdf')

for country in list_country_unique:

    # 感染者数データから特定の国を抜き出し、新規感染者数データを計算
    df_country_infected = df_infected[df_infected['Country/Region'] == country] #countryの国の行を抽出
    df_country_infected_sum = df_country_infected.sum() #各行の列をsumしてデータフレームのシリーズへ
    df_country_infected_difference = pd.Series([df_country_infected_sum[i+1]-df_country_infected_sum[i] for i in range(3,len(df_country_infected_sum)-1)]) #各日の推移を算出。ただの引き算
    df_country_infected_difference[df_country_infected_difference < 0] = 0
    df_country_infected_columns = pd.to_datetime(pd.Series(df_infected.columns)[4:])

    # 死者数データから特定の国を抜き出し、新規死者数数データを計算
    df_country_death = df_death[df_death['Country/Region'] == country] #countryの国の行を抽出
    df_country_death_sum = df_country_death.sum() #各行の列をsumしてデータフレームのシリーズへ
    df_country_death_difference = pd.Series([df_country_death_sum[i+1]-df_country_death_sum[i] for i in range(3,len(df_country_death_sum)-1)]) #各日の推移を算出。ただの引き算
    df_country_death_difference[df_country_death_difference < 0] = 0
    df_country_death_columns = pd.to_datetime(pd.Series(df_death.columns)[4:])

    #ワクチン接種データから特定の国を抜き出し
    df_vaccine_country = df_vaccine[df_vaccine['location'] == country] #ワクチン接種率データから特定の国抜き出し

    # グラフ化
    fig, ax1 = plt.subplots(figsize=(14, 7), dpi = 100)
    ax1.bar(df_country_infected_columns, df_country_infected_difference, width=2, alpha = 1, color='c', label="Number of New Infections")
    ax1.set_ylabel("Number of New Infections", fontsize=12)
    # ax1.tick_params(axis="x", labelrotation=45)
    ax1.set_ylim([0, df_country_infected_difference.max() + df_country_infected_difference.max()/10])

    ax2 = ax1.twinx()
    ax2.bar(df_country_death_columns, df_country_death_difference, width=2, alpha = 0.3, color='r', label="Number of Deaths")
    ax2.set_ylabel("Number of Deaths", fontsize=12)
    ax2.set_ylim([0, (df_country_infected_difference.max() + df_country_infected_difference.max()/10)/20])
    ax2.spines["right"].set_position(("axes", 0.3))

    ax3 = ax1.twinx()
    ax3.plot(pd.to_datetime(pd.Series(df_vaccine_country['date'])), df_vaccine_country['total_boosters_per_hundred'].interpolate(limit_direction='both'), lw=2, alpha = 0.7, color='g', label="Vaccination Rate (boosters)", linestyle = "dotted")
    ax3.set_ylabel("Vaccination Rate (boosters) [%]", fontsize=12)
    ax3.set_ylim([0, 100])

    ax1.grid(axis='x',linestyle='--', color='g', linewidth=0.2)
    ax1.grid(axis='y',linestyle='--', color='g', linewidth=0.2)

    # 凡例をまとめて出力する
    handler1, label1 = ax1.get_legend_handles_labels()
    handler2, label2 = ax2.get_legend_handles_labels()
    handler3, label3 = ax3.get_legend_handles_labels()
    ax1.legend(handler1 + handler2 + handler3, label1 + label2 + label3)

    plt.title('COVID-19 Transition per Day in ' + country, fontsize=18)
    fig.subplots_adjust(right = 0.85)
    pdf.savefig()

pdf.close()この記事が気に入ったらサポートをしてみませんか?
