
GMMAの短期線・長期線をひとまとめにできるインジケーター【TradingView】

こんにちは、まっつ@matsu_bitmexです。
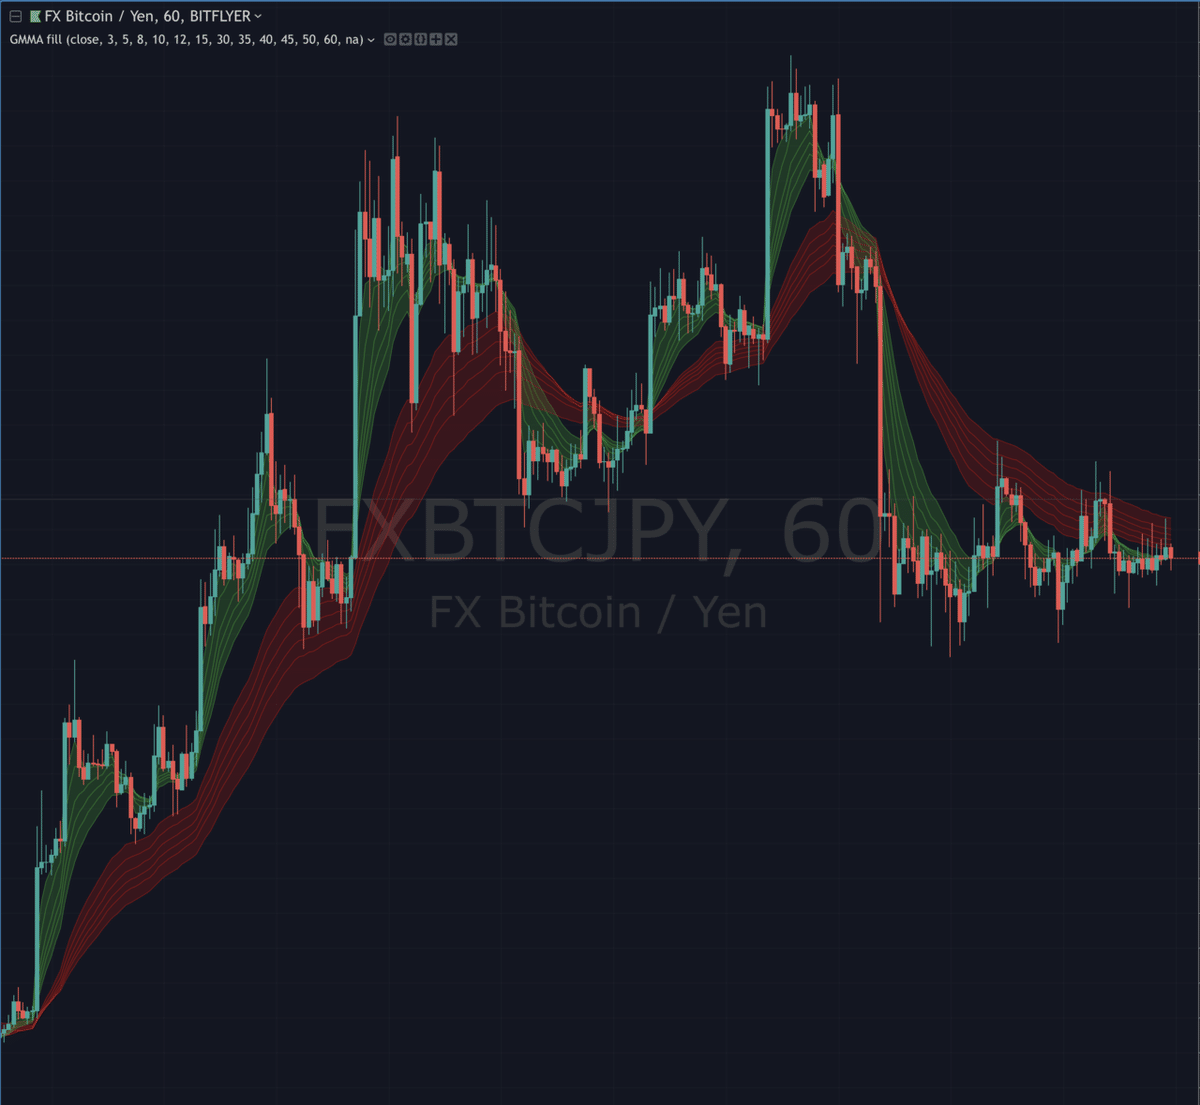
GMMAの短期線・長期線をそれぞれに背景色を付けることで1本の太いラインのように表示できるインディケーターを公開しました。
更新履歴
・2018/12/27 Trend Color mode ・ Display GC/DC mode を追加
・2019/02/20 アラート機能を追加
・2019/07/13 GMMA fill+ ソースコードを追加
「GMMA fill」と検索すると使えます。
GMMAの短期線・長期線はひとまとめにして見ろ、とどこかで見かけたので作成しました。普通のGMMAよりトレンドが把握しやすいです。

GMMAの使い方についてはこちらのnoteがめちゃくちゃ参考になると思います。(オススメ)
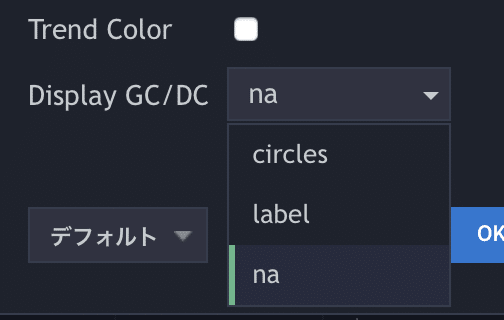
設定項目こんな感じ。

以上、GMMA fillの紹介でした。
最後まで読んでいただきありがとうございます。よかったらnoteのフォロー/スキ、お願いします。また、インジの作成受け付けてますのでアイディアあればお気軽にご相談ください。ではまた!
2018/12/27 追記
Trend Color mode ・ Display GC/DC mode を追加しました。
○ Trend Color
パーフェクトオーダーで色が変わります。上昇トレンドで全て緑、下降トレンドで全て赤になります。

○ Display GC/DC
短期束と長期束のゴールデンクロス/デッドクロスでサインが出ます。
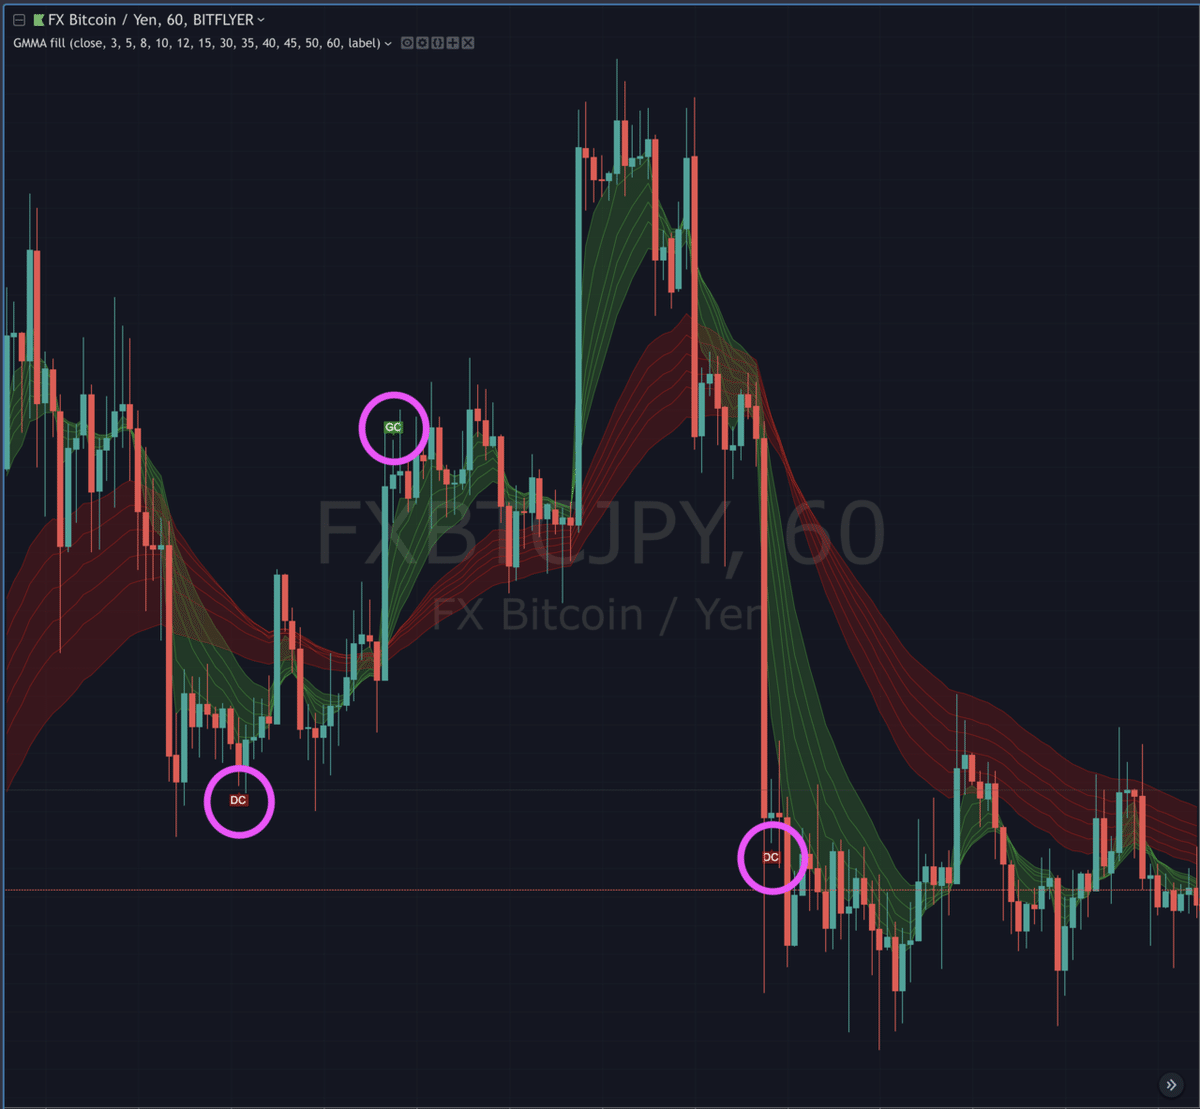
label と circles が選択できます。

短期線1〜5がすでにクロスしていて、最後に短期線6(デフォでは期間15)がクロスしたタイミングでシグナルが出ます。予想外のタイミングでシグナルが出たり、思ってたタイミングで出ない場合もありますが、そういう条件にしてるので仕方ない、と割り切ってください。だいたい大丈夫なはずです。
2019/02/20 追記
◯ Trend Colorの色を変更しました。
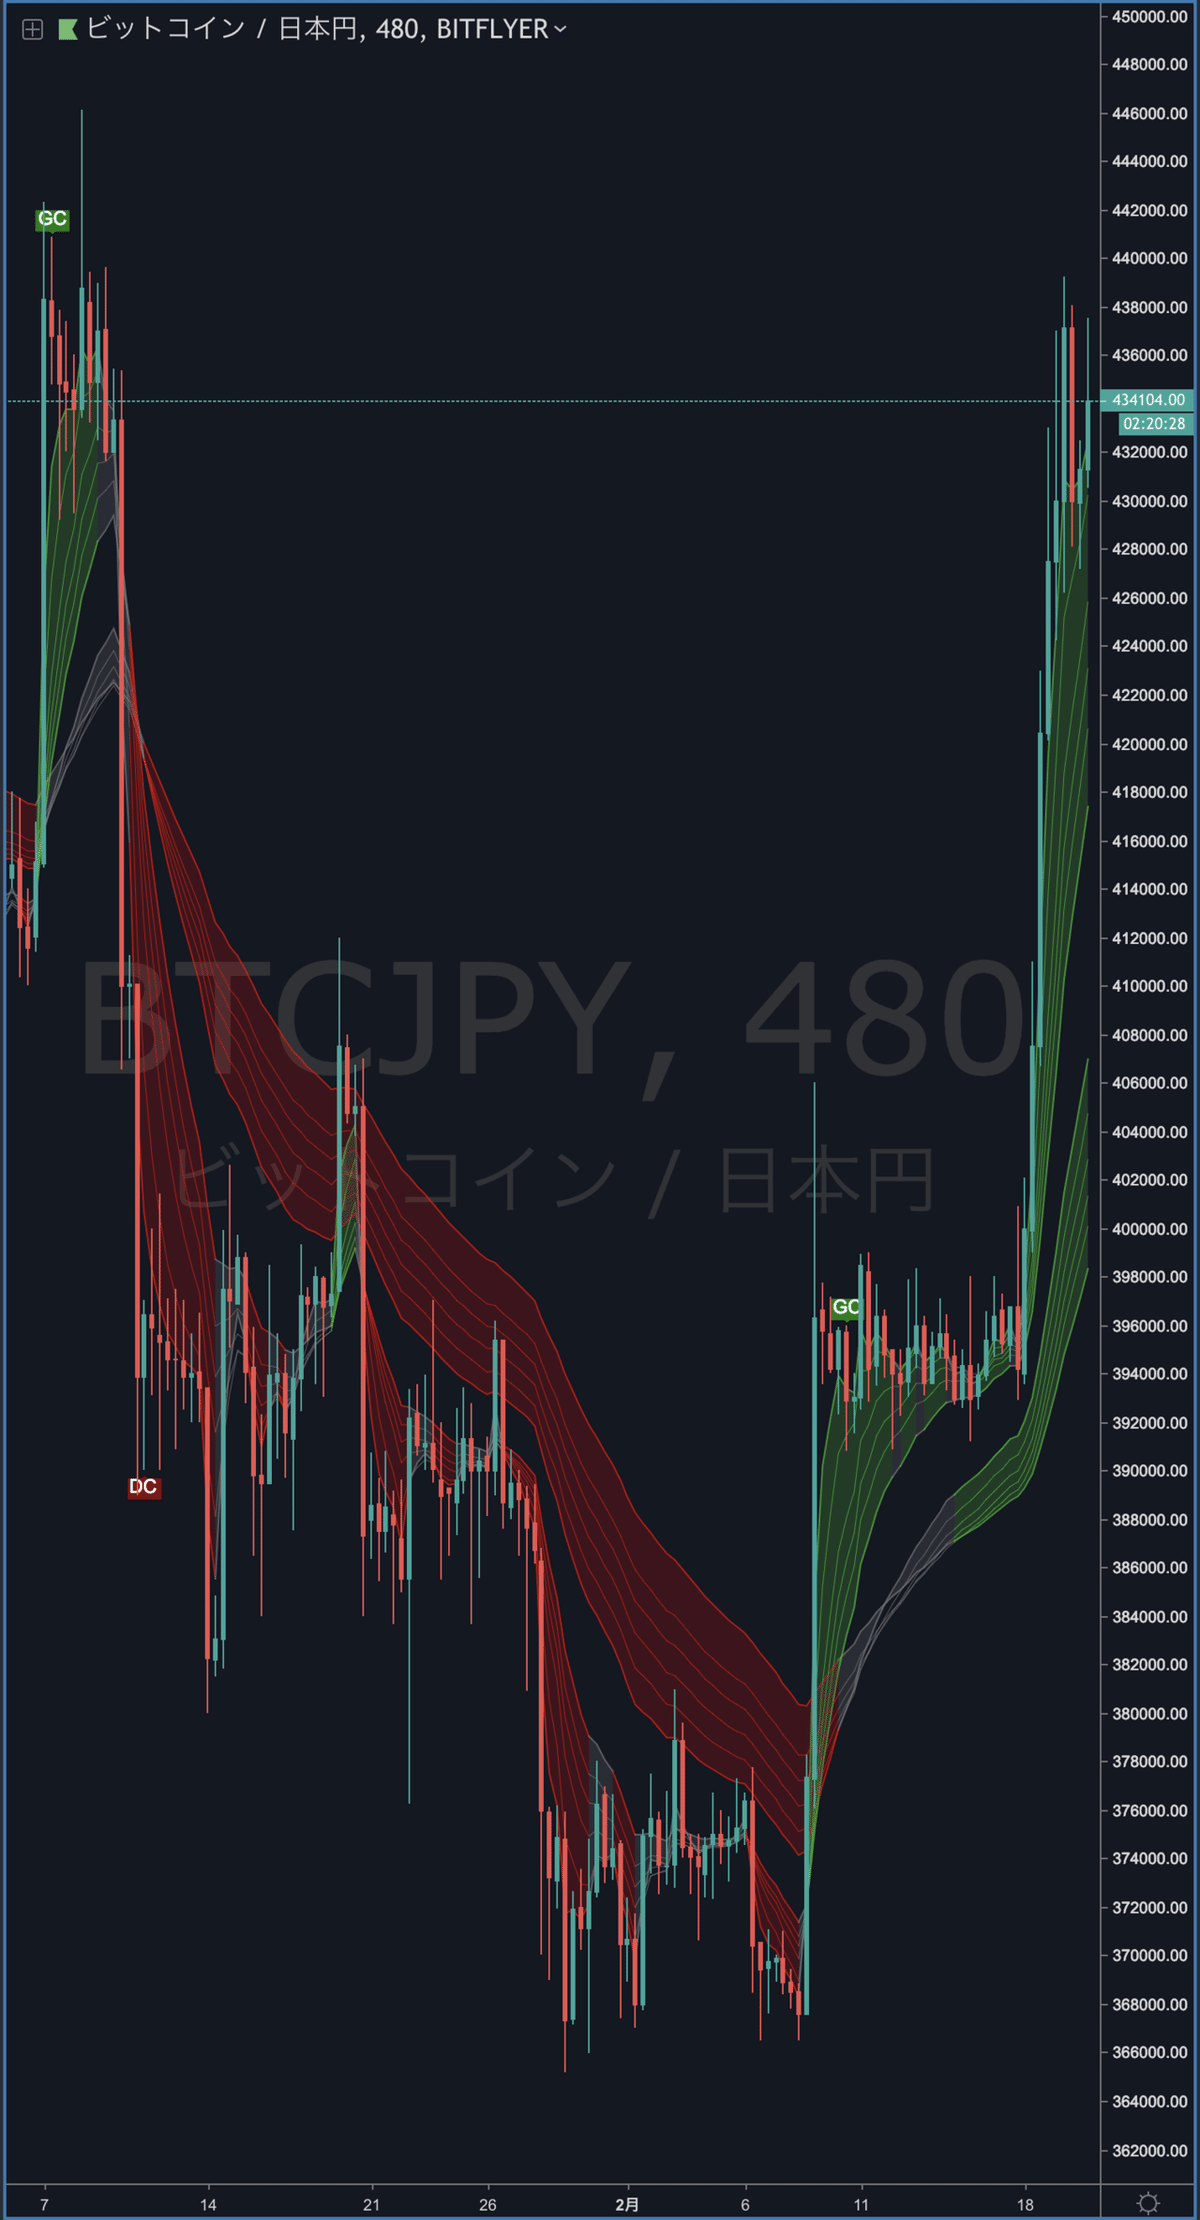
短期束がパーフェクトオーダーで緑/赤、それ以外は灰色。
長期束がパーフェクトオーダーで緑/赤、それ以外は灰色。
組み合わせは6通りですね。
◯ アラート機能を追加しました。

1. GC/DC どちらでもアラート
2. GC でアラート
3. DC でアラート
お役に立ててください。
最後に、ソースコード置いておきます。
//@version=3
study("GMMA fill", overlay=true)

//input ------
src = input(close, title="source")

len1 = input(3, title="short length 1")
len2 = input(5, title="short length 2")
len3 = input(8, title="short length 3")
len4 = input(10, title="short length 4")
len5 = input(12, title="short length 5")
len6 = input(15, title="short length 6")

len7 = input(30, title="long length 1")
len8 = input(35, title="long length 2")
len9 = input(40, title="long length 3")
len10 = input(45, title="long length 4")
len11 = input(50, title="long length 5")
len12 = input(60, title="long length 6")

trend_color = input(false, title="trend color")

//ema -----
s1 = ema(src, len1)
s2 = ema(src, len2)
s3 = ema(src, len3)
s4 = ema(src, len4)
s5 = ema(src, len5)
s6 = ema(src, len6)
l1 = ema(src, len7)
l2 = ema(src, len8)
l3 = ema(src, len9)
l4 = ema(src, len10)
l5 = ema(src, len11)
l6 = ema(src, len12)

//trend
trend_up_s = s1 > s2 and s2 > s3 and s3 > s4 and s4 > s5 and s5 > s6
trend_up_l = l1 > l2 and l2 > l3 and l3 > l4 and l4 > l5 and l5 > l6

trend_down_s = s1 < s2 and s2 < s3 and s3 < s4 and s4 < s5 and s5 < s6
trend_down_l = l1 < l2 and l2 < l3 and l3 < l4 and l4 < l5 and l5 < l6

color_s = trend_color and trend_up_s ? #32cd32 : trend_color and trend_down_s ? red : trend_color ? gray : #32cd32
color_l = trend_color and trend_up_l ? #32cd32 : trend_color and trend_down_l ? red : trend_color ? gray : red

//plot -----
p_l1 = plot(l1, color=color_l, title="long 1", linewidth=2)
p_l2 = plot(l2, color=color_l, title="long 2")
p_l3 = plot(l3, color=color_l, title="long 3")
p_l4 = plot(l4, color=color_l, title="long 4")
p_l5 = plot(l5, color=color_l, title="long 5")
p_l6 = plot(l6, color=color_l, title="long 6", linewidth=2)

p_s1 = plot(s1, color=color_s, title="short 1", linewidth=2)
p_s2 = plot(s2, color=color_s, title="short 2")
p_s3 = plot(s3, color=color_s, title="short 3")
p_s4 = plot(s4, color=color_s, title="short 4")
p_s5 = plot(s5, color=color_s, title="short 5")
p_s6 = plot(s6, color=color_s, title="short 6", linewidth=2)

//fill -----
fill(p_l1, p_l6, color_l, 80, "fill long 1-6")
fill(p_s1, p_s6, color_s, 80, "fill short 1-6")

//GCDC -----
disp_gcdc = input("na", options=["na", "circles", "label"], title="display GC/DC")

gmma_cross(gmma) =>
	flag = 0
	if gmma > l1 and gmma > l2 and gmma > l3 and gmma > l4 and gmma > l5 and gmma > l6
		flag := 1
	if gmma < l1 and gmma < l2 and gmma < l3 and gmma < l4 and gmma < l5 and gmma < l6
		flag := -1
	flag

s1_cross = gmma_cross(s1)
s2_cross = gmma_cross(s2)
s3_cross = gmma_cross(s3)
s4_cross = gmma_cross(s4)
s5_cross = gmma_cross(s5)
s6_cross = gmma_cross(s6)

cross_cnt = s1_cross + s2_cross + s3_cross + s4_cross + s5_cross

gc = cross_cnt==5 and crossover(s6_cross, 0) ? true : false
dc = cross_cnt==-5 and crossunder(s6_cross, 0) ? true : false

plotshape(gc and disp_gcdc=="label", style=shape.labeldown, color=green, transp=0, location=location.abovebar, text="GC", textcolor=white, title="GC label")
plotshape(dc and disp_gcdc=="label", style=shape.labelup, color=maroon, transp=0, location=location.belowbar, text="DC", textcolor=white, title="DC label")
plot(disp_gcdc=="circles" ? s6 : na, style=circles, linewidth=4, color= gc ? lime : dc ? red : na, transp=0, title="GC/DC circles")

alertcondition(gc or dc, "1. Alert GMMA cross", "GMMA cross")
alertcondition(gc, "2. Alert GMMA GC", "GMMA GC")
alertcondition(dc, "3. Alert GMMA DC", "GMMA DC")
- - - - - 2019/07/13 追記 - - - - -
有料パートにぼくが今メインで使っているGMMA改良版のソースコードを置いておきます。


GMMAに EMA 期間 20 ・ 70 ~ 120 と SMA 期間 200 を追加したものです。配色はDark Themeに合わせてあります。PINEスクリプトからインジを追加できるよ、って方はよかったら使ってみてください。
ここから先は
¥ 500
この記事が気に入ったらサポートをしてみませんか?