【Three.js】CSVファイルを読み込んで3D散布図を描く

Three.js をデータ可視化ツールとして使えないか、いろいろと検討しています。
この記事の Three.js 版です。
今回もCSVファイルを読み込んで、3D散布図を描いてみようと思います。
1. フォルダ構成

このように、同じフォルダの中に
・fuga.html
・piyo.js
・iris.csv
を格納しています。
2. ファイルの中身
fuga.html
<!DOCTYPE html>
<html>
<head>
   <meta charset="utf-8"/>
   <script type="module" src="piyo.js"></script>
</head>
<body>
   <canvas id="myCanvas"></canvas>
</body>
</html>
piyo.js
import * as THREE from "https://cdnjs.cloudflare.com/ajax/libs/three.js/r128/three.module.min.js";
// ページの読み込みを待つ
window.addEventListener('load', init);

function init() {

   // サイズを指定
   const width = 960;
   const height = 540;

   const loader = new THREE.FileLoader();

   //load a text file and output the result to the console
   loader.load(
       // resource URL
       'iris.csv',

       // onLoad callback
       function ( data ) {
           // output the text to the console
           const rows = data.split('\r\n');
           for (let i = 0; i < rows.length; i++) {
               if (i != 0 & rows[i] != '') {
                   const values = rows[i].split(',');

                   const geometry = new THREE.SphereGeometry(8, 8, 8);
                   const material = new THREE.MeshBasicMaterial();
                   if (values[4] == "\"setosa\"") {
                       material.color.setRGB(1.0, 0.0, 0.0);
                   } else if (values[4] == "\"versicolor\"") {
                       material.color.setRGB(0.0, 1.0, 0.0);
                   } else if (values[4] == "\"virginica\"") {
                       material.color.setRGB(0.0, 0.0, 1.0);
                   }
               const mesh = new THREE.Mesh(geometry, material);

                   mesh.position.set(
                       (Number(values[0]) - 5.8) * 100,
                       Number(values[2]) * 100,
                       Number(values[1]) * 100
                   );
                   group.add(mesh);
               }
           }
       },

       // onProgress callback
       function ( xhr ) {
           console.log( (xhr.loaded / xhr.total * 100) + '% loaded' );
       },

       // onError callback
       function ( err ) {
           console.error( 'An error happened' );
       }
   );

   // レンダラーを作成
   const renderer = new THREE.WebGLRenderer({
   canvas: document.querySelector('#myCanvas')
   });
   renderer.setPixelRatio(window.devicePixelRatio);
   renderer.setSize(width, height);

   // シーンを作成
   const scene = new THREE.Scene();
   const group = new THREE.Group();
   scene.add(group);

   // カメラを作成
   const camera = new THREE.PerspectiveCamera(45, width / height);
   camera.position.set(300, 300, 1500);

   tick();

   // 毎フレーム時に実行されるループイベントです
   function tick() {
       group.rotation.y += 0.01;
       renderer.render(scene, camera); // レンダリング

       requestAnimationFrame(tick);
   }
};
iris.csv
これは以前の記事と同様、統計ソフトRに入っている iris データをCSV出力したものです。
ファイルの中身をテキストエディタで確認すると

このようになっています。
コードのポイント
iris.csv 内では文字列がダブルクォートで囲まれています。
piyo.js 内であやめの種類別に色を変えるところで条件判定をしているのですが、ダブルクォートを含んだ文字列として比較しています。(ちょっとハマりました)
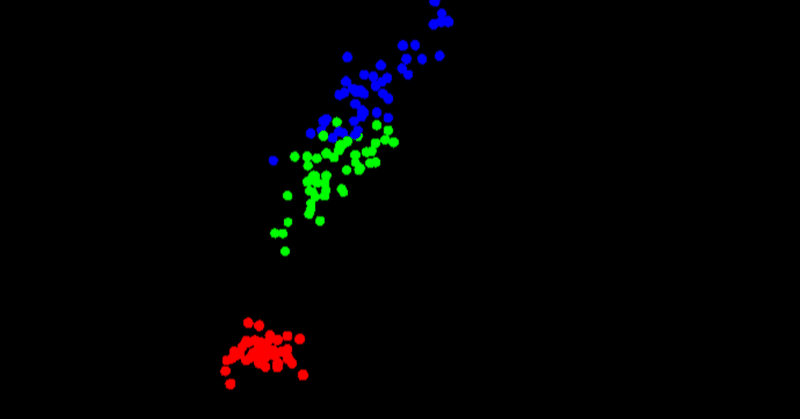
実行結果
今回のコードもローカルでファイルを開いても動作しないので、Web サーバーを立てて実行します。

material などを細かく設定していないのでのっぺりした画面になっていますが、CSV ファイル内のデータを反映した3D散布図になっていますね。
この記事が気に入ったらサポートをしてみませんか?