The Relation between Same-Sex Marriage Legalization and Fertility Rate

Author: Takuya Kimpara
Advisor: Dr. Phillip R. Morrow
18 January 2022
Abstract
There is an argument that same-sex marriage decreases the birth rate because some people with same-sex attraction might marry people of the opposite sex if there is no same-sex marriage, however, people with same-sex attraction will marry people of the same sex if same-sex marriage is legalized. I analyzed how birth rate changed after same-sex marriage legalizations in the US and summarized some articles about the relation between same-sex marriage and birth rate. I made a graph of the birth rate of 12 states in the US between 1990 and 2016 and analyzed the transition around the years of the same-sex legalizations for each state considering the US average birth rate. I found that in the most populated 10 states and other 2 states, the birth rate declined on average when same-sex marriage was legalized. However, the average birth rate of all the 50 states declined more on average when the 12 states legalized same-sex marriage.
Keywords: same-sex marriage, birth rate, homosexuality, LGBTQ, queer
Introduction
Since the Netherlands legalized same-sex marriage in 2000, same-sex marriage legalization has been a popular topic especially in developed countries. However, only 30 countries out of 195 have legalized same-sex marriage as of December 2021 (“Same-sex marriage is now legal in 30 countries”). One reason not to legalize same-sex marriage often said by politicians is that same-sex marriage decreases birth rate. Masahiko Shibayama, a member of the house of representatives in Japan said, “legalizing same-sex marriage will accelerate the declining birthrate” (“Shibayama monkasho sannenmae no doseikon ‘shoshika ni hakusha’ hatsugen wo hansei (Shibayama, a member of the Ministry of Education, Culture, Sports, Science and Technology of Japan, reflects on the statement that same-sex marriage ‘accelerating the declining birthrate’ three and a half years ago)”). Masateru Shiraishi, a member of Adachi City Assembly, said, “It's impossible, but if all the Japanese become L (lesbian) and G (gay), no next generation will be born”, “if it’s said that both L and G are protected by the law, Adachi Ward will cease to exist”, and “Lesbians and gays are a matter of their own way of life and I am not willing to interfere, but I oppose the movement to protect them by law. I’m not going to accept (the way of life)” (“Doseiai hirogareba ‘adachi ku horobiru’ Shiraishi Masateru, jimin kugi ga gikai de hatsugen (If homosexuality spreads, ‘Adachi Ward will cease to exist’ Masateru Shiraishi, a member of the Liberal Democratic Party and the Ward Assembly said in the parliament)”). Both Masahiko Shibayama and Masateru Shiraishi are the members of the Liberal Democratic Party in Japan which has been in power almost continuously since its foundation in 1955 and occupies approximately 56% of the members of the House of Representatives; 262 out of 465 as of 10 November 2021 “Kaihamei oyobi kaihabetsu shozokugiinnsu (Parliamentary group name and number of members by parliamentary group)”). It is so commonly said that same-sex marriage decreases the birth rate that the members of the biggest and most powerful party of a country say.
However, actual data are often not provided while the logic is often said such as “the birth rate will decrease because people with the same-sex attraction who would have children after marrying those of the opposite sex will not have children since they have a better choice, same-sex marriage” or “the birth rate will not change much because there are only few people with the same-sex attraction who would have children”. That is why I decided to analyze the transition of the birth rate when same-sex marriage was legalized. This paper analyzes the birth rate transition in the US when each state legalized same-sex marriage, shows factors that can affect the birth rate other than same-sex marriage, then, summarizes two articles that do not conclude that birth rate either decreased or increased significantly by the influence of same-sex marriage.
Methodology
In order to grasp the birth rate transition in the US, I made a table of the birth rate in the 12 states between 1990 and 2019.
Table 1
Birth Rate Transition in the US

Source: “Birth rate: Massachusetts and US, 1990-2019”.
Table 1 is the list of birth rates between 1990 and 2019 in the 10 most populated states and 2 states that legalized same-sex marriage earliest in the US. I decided to list up most populated states because I judged that populated states would reflect the influence caused by same-sex marriage legalizations more clearly than less populated states. In addition, I added two states that legalized same-sex marriage earlier than other states in order to compare the data in different years as a lot of states legalized around 2015 and to prevent bias due to the influence of economic situations and political policies as much as possible.
Table 2
Rate of Change in Birth Rate before and after Same-sex Marriage Legalizations

Source: “Birth rate: Massachusetts and US, 1990-2019”.
Note: The most populated states were chosen based on “US States - Ranked by Population 2021.”
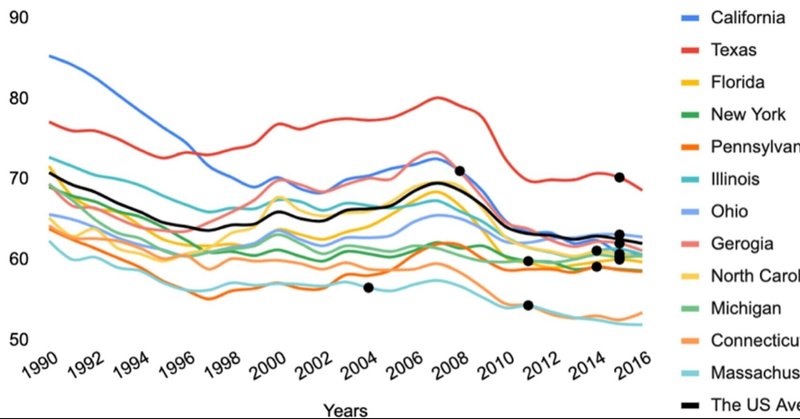
Graph 1
Birth Rate Transition by State

Source: “Birth rate: Massachusetts and US, 1990-2019”.
Note: The black bullets are roughly the times of same-sex legalization (Bullets can only be on January 1st in the year and not between because of the graph making system. Therefore, the bullets are closest to the days of legalization, however, they are not 100% accurate. I considered anytime between January and June as 1 January in the same year and anytime between July and December as 1 January in the next year. For example, Massachusetts legalized same-sex marriage on 18 November 2003, however, the bullet is on 1 January 2004.)
Table 2 shows that the birth rate decreased in 7 states and increased in 5 states out of the 12. The average birth rate of the 12 states within 2 years after the legalizations decreased by 0.73% from that of the 12 states within 2 years before the legalizations.
However, in Graph 1, S shaped lines were found in Massachusetts, Connecticut, Pennsylvania, and Illinois. Even though the birth rates decreased within 4 years in these states except Illinois, we could interpret that the birth rates in these states were decreasing 2 years before the legalizations and the legalizations caused an increase for around a year, then the rates started decreasing again.
On the other hand, Michigan had a flipped-S shaped line. This can be interpreted as that the birth rate was increasing and the legalization caused a decrease, then started increasing again even though the birth rate in Michigan increased from 60 to 60.5 within 4 years.
Table 3
Rate of Change of Average Birth Rate of 50 States

Source: “Birth rate: Massachusetts and US, 1990-2019”.
Note: The “Rate of Change when Each State Legalized Same-sex Marriage (All States Average), Rate of Change (State), and (State Rate of Change – All States Average Rate of Change) were made by the author of this paper, Takuya Kimpara.
Overall, Table 2 and Graph 1 indicate that same-sex marriage decreased the birth rate in the most populated states and two other states in the US. However, the results are different if we consider the average birth rate of the whole US. Table 3 indicates that rate of change of the 12 states is higher than the average rate of change of all the 50 states if we consider influences other than same-sex marriage. The average rate of change for the two years prior to and the two years following the legalizations of the 12 states when same-sex marriage was legalized was -0.75% and the average rate of change of all 50 states was -1.27%. The birth rate of the 12 states declined around the times of same-sex legalizations, however, the birth rate of the whole US at those times declined more. The average birth rate of the whole US declined approximately 57% more than the 12 states.
The adjusted rates of change of the 12 states are subtracted from the rates of change of all the 50 states at the same time of each state’s legalizations. Therefore, even if the birth rate of a state out of the 12 states declined by 3%, if the average birth rate of all 50 states declined by 3% too in the same years, the adjusted rate of change would be 0%. On the other hand, if the birth rate of a state declined by 3% and the average birth rate of all 50 states increased by 3%, the adjusted rate of change would be -6%. This way, we can see better how one state’s birth rate changed around the time of same-sex marriage legalization in contrast to the whole US birth rate at the same time. I subtracted the rates of change of the 12 states by the rates of change of all 50 states as an attempt to reduce influences other than same-sex marriage that can affect birth rate as much as possible. For example, it is likely that a down economy tends to decrease the birth rate probably because people, especially younger generations, feel insecure about their financial situations and refrain from having children. As a matter of fact, when the bankruptcy of Lehman Brothers occurred in 2008, the birth rate especially of young generations in most US states declined rapidly. Graph 2 shows that the birth rate of age groups of 15-19 and 20-24 greatly decreased around 2007. Also, the article I quoted below claims that down economy decreases births. Therefore, even if birth rate decreased or increased due to influences other than same-sex marriage, the adjusted rate of change does not decrease or increase much like the actual rate of change, and it reflects more pure effects of same-sex marriage than the actual rate of change.
The Influence of a Down Economy on Birth Rate
That being said, we need to keep in mind that this research does not conclude same-sex marriage either decreases or increases the birth rate and there are other possible factors that affect the birth rate. For example, the existing age-sex structure, social and religious beliefs, especially in relation to contraception and abortion, female employment, and infant mortality rate; a family may have more children if a country's infant mortality rate is high as it is likely some of those children will die and vice versa. Even the adjusted change of rate in Graph 3 might reflect economic situation in each state. This is because economic situation in each state is not in the calculation even though the adjusted rate lessens the difference between states.
Graph 2
Birth Rates by Mother’s Age Groups

Source: “Births: Final Data for 2014.”
“This research capitalizes on such across-state differences to examine whether the economic downturn is associated with the sharp fertility declines that the U.S. has experienced since 2007. Six of the seven economic indicators that the Pew Research Center analyzed were strongly linked to subsequent changes in fertility at the state level. In particular, changes in per capita personal income, per capita GDP, employment rate, unemployment rate and initial unemployment claims from 2007 to 2008 were closely related to changes in fertility rates occurring from 2008 to 2009, as were 2008 state-level foreclosure rates.3 The change from 2007 to 2008 in the Home Price Index, an indicator of housing value, was not linked to subsequent fertility.
In 48 of 51 states (a number that includes the District of Columbia), fertility declines occurred within one to two years of the start of economic declines (as indicated by the percent change in personal income per capita, and the percent change in the employment rate). This does not conclusively prove that the economic changes led to fertility changes. However, the timing is consistent with the time it might take people to act upon fertility decisions (“In a Down Economy, Fewer Births” Par. 9 and 10).”
Birth Rate of the Countries that Legalized Same-sex Marriage
Next, I will summarize two articles that conclude that the birth rate was neither decreased nor increased significantly by the influence of same-sex marriage.
The first article, “LGBT Shoshika To Mukankei (LGBT is unrelated to fertility decline)” concludes that same-sex marriage and fertility decline are unrelated as the increase and decrease of birth rate after same-sex marriage legalization differ depending on the country and they cannot say either “the fertility decline improved” or “the fertility rate declined.” The article also says that Yuichi Kamiya, the director-general of Japan Alliance of LGBT Legislation, claimed, “The fertility decline has been exploited to blame for LGBT. I do not hear that legislation for diverse sexuality lead to fertility decline.” Then, the article shows a graph (Graph 3) of the birth rate of Japan which has not legalized same-sex marriage and 24 countries that have legalized same-sex marriage.
Graph 3
Comparison of Birth Rates of Countries that have Legalized Same-sex Marriage and Japan

(Retrieved from “LGBT Shoshika To Mukankei (LGBT is unrelated to fertility decline).”
In Graph 3, the white bar shows Japan’s birth rate. Japan had the 3rd lowest birth rate in the graph. 22 of the 24 countries such as South Africa, Argentina, France, and the US had higher birth rates than Japan in 2016 for Japan and in 2017 for the countries that have legalized same-sex marriage. However, I cannot conclude that same-sex marriage increased the birth rate because the graph does not include all the countries that have legalized same-sex marriage and each country has different policies and economic situations and I am not aware of all factors that affect birth rate and I believe that it is impossible to find out all of them by science today.
The other article, “Sexual Minority To Doseikon (Sexual Minority and Same-sex Marriage)” shows a table of birth rate of some countries that have legalized same-sex marriage.
Table 4
Change in Birth Rate of Countries that have Legalized Same-sex Marriage

(Retrieved from “Sexual Minority to Doseikon (Sexual Minority and Same-sex Marriage)” Pg. 5. Translated and edited by the author.)
Table 4 shows that there are countries in which the birth rate increased, decreased, or did not change significantly at around the time of same-sex marriage legalizations. For Denmark and Netherlands, the author compared the birth rate in the year of the legalizations and birth rate after the legalizations. For France, Argentina, Hungary, and Iceland, they compared the birth rates before and after the legalizations. For Germany, they compared the birth rates before the legalization. I assume that we should compare the birth rates in the years closer to those years in which the countries legalized same-sex marriage. However, the data can still give us a partial idea of the relation between same-sex marriage legalization and birth rate.
Conclusion
There are three main findings. The first finding is that the average birth rate of the whole US declined more than the birth rate of the states that legalized same-sex marriage when same-sex marriage was legalized in the ten most populated states and two other states, Massachusetts and Connecticut, that legalized same-sex marriage earlier than any other sates in the US. In the 12 states, the birth rate declined by 0.73% on average within 4 years when same-sex marriage was legalized. However, the average birth rate of all the 50 states declined by 1.27% on average when the 12 states legalized same-sex marriage. The average birth rate of the whole US declined approximately 57% more than the average birth rate of the 12 states.
The second finding is that even though Japan has not legalized same-sex marriage as of November 30, 2021, there were at least 22 countries that had legalized same-sex marriage and had a higher birth rate than Japan in 2016 for Japan and in 2017 for the countries that have legalized same-sex marriage.
The third finding is that there are countries in which the birth rate increased, decreased, or did not change significantly at around the time of same-sex marriage legalizations.
That being said, this paper does not determine that same-sex marriage either decreased or increased birth rate. This paper only presented data that can indicate the relation between same-sex marriage and birth rate. This issue awaits more future research to make a conclusion about whether same-sex marriage affects birth rate or not.
Works Cited
“Birth rate: Massachusetts and US, 1990-2019.” MARCH OF DIMES, 2021. https://www.marchofdimes.org/peristats/ViewSubtopic.aspx?reg=25&top=2&stop=1&lev=1&obj=1&cmp=99&slev=4&sty=1990&eny=2019&chy=
“Doseiai hirogareba ‘adachi ku horobiru’ Shiraishi Masateru, jimin kugi ga gikai de hatsugen (If homosexuality spreads, “Adachi Ward will cease to exist” Masateru Shiraishi, a member of the Liberal Democratic Party and the Ward Assembly said in the parliament).” Tokyo Web, The Tokyo Shimnun, 3 October 2020. https://www.tokyo-np.co.jp/article/59502
Hamilton, Brady, Joyce A Martin, Michelle J K Osterman, and Sally C Curtin, Tj Mathews. “Births: Final Data for 2014.” ResearchGate, 23 December 2013. https://www.researchgate.net/figure/Birth-rates-by-age-of-mother-United-States-1990-2014_fig1_303081401
“Kaihamei oyobi kaihabetsu shozokugiinnsu (Parliamentary group name and number of members by parliamentary group).” The House of Representatives, Japan, 10 November 2021. https://www.shugiin.go.jp/internet/itdb_annai.nsf/html/statics/shiryo/kaiha_m.htm
“LGBT Shoshika To Mukankei (LGBT is unrelated to fertility decline)”. Japanese Communist Party, 18 January 2019. https://www.jcp.or.jp/akahata/aik18/2019-01-18/2019011802_02_1.html
Livingston, Gretchen. “In a Down Economy, Fewer Births.” Pew Research Center, 12 October 2011. https://www.pewresearch.org/social-trends/2011/10/12/in-a-down-economy-fewer-births/
“Marriage rate in Massachusetts from 1990 to 2019.” Statista Research Department, 2 Mar 2021. https://www.statista.com/statistics/206965/marriage-rate-in-massachusetts/
“Same-sex marriage is now legal in 30 countries.” The Japan Times, 8 December 2021. https://www.japantimes.co.jp/news/2021/12/08/world/social-issues-world/gay-marriage-progress/
“Shibayama monkasho sannenmae no doseikon ‘shoshika ni hakusha’ hatsugen wo hansei (Shibayama, a member of the Ministry of Education, Culture, Sports, Science and Technology of Japan, reflects on the statement that same-sex marriage ‘accelerating the declining birthrate’ three and a half years ago).” The Mainichi, 14 November 2018. https://mainichi.jp/articles/20181115/k00/00m/010/009000c
Tajima, Kazuki. “Sexual Minority To Doseikon (Sexual Minority and Same-sex Marriage).” https://www.andrew.ac.jp/gakuron/pdf/gakuron31-2.pdf
“US States - Ranked by Population 2021.” World Population Review, 2021. https://worldpopulationreview.com/states
この記事が気に入ったらサポートをしてみませんか?