
(MT5)ドンチャンチャネルを使いたい!【MQL5】

今回紹介するインジケータは「ドンチャンチャネル」。
「ドンチャンチャネル」とは。
アメリカの投資家「リチャード・ドンチャン」氏が考案したとされるテクニカル分析の1つです。
1970年初頭に開発されたテクニカル指標で、順張りトレードのために使われます。
Youtubeで「ドンチャンチャネル」を使った手法も紹介されている手法ですね。
ドンチャンブレイクアウト・トレンドフォロー手法
エントリー:過去20日間 or 過去55日間の最高値、最安値を更新時に順張り
エグジット:過去10日間の最安値、最高値を更新時
エントリー後に逆行した場合、資金の2%で損切
利益確定の指値は置かない
手法は上記の内容になってます。
いわゆる低勝率の中で伸ばせる利益を大きく伸ばす、コツコツ負けてドカンと勝つ売買手法というわけですね。
MT5で使いたい!
残念ながらMT4やMT5ではデフォルトで搭載されているインジケータではないので、外部から取り込んでくる必要があります。
ということで、作ってみました。
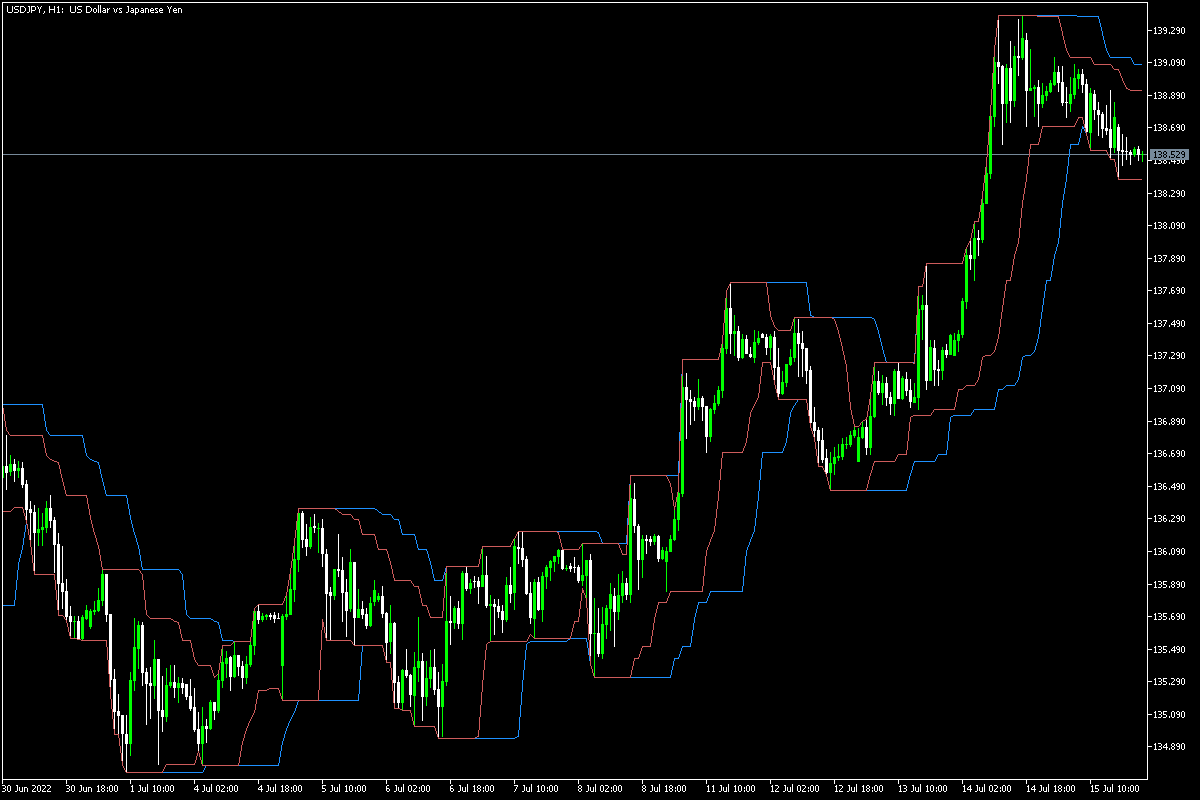
青:期間20での最高値
赤:期間10での最安値
出回っているものの中では一番シンプルに仕上げたつもりです。
以下からダウンロードできます。
使ってみたい方はぜひ使ってみてください。
サンプルコードを知りたい
カスタマイズできるよう、今回のコードをサンプルとしてあげておきます。
MQL5で使用可能です。変更箇所はありません。
カスタマイズして使いたいよって方は、以下コードをベースにカスタマイズしたい箇所を変更して使ってみてください。
//+------------------------------------------------------------------+
//|                                              DonchianChannel.mq5 |
//|                                            Copyright 2022, じゅにこ. |
//|                            https://coconala.com/services/2119358 |
//+------------------------------------------------------------------+
#property copyright "Copyright 2022, じゅにこ."
#property link      "https://coconala.com/services/2119358"
#property version   "1.00"
#property indicator_chart_window
#property indicator_buffers 4
#property indicator_plots   4
//--- plot Upper1
#property indicator_label1  "Upper1"
#property indicator_type1   DRAW_LINE
#property indicator_color1  clrDodgerBlue
#property indicator_style1  STYLE_SOLID
#property indicator_width1  1
//--- plot Lower1
#property indicator_label2  "Lower1"
#property indicator_type2   DRAW_LINE
#property indicator_color2  clrDodgerBlue
#property indicator_style2  STYLE_SOLID
#property indicator_width2  1
//--- plot Upper2
#property indicator_label3  "Upper2"
#property indicator_type3   DRAW_LINE
#property indicator_color3  clrIndianRed
#property indicator_style3  STYLE_SOLID
#property indicator_width3  1
//--- plot Lower2
#property indicator_label4  "Lower2"
#property indicator_type4   DRAW_LINE
#property indicator_color4  clrIndianRed
#property indicator_style4  STYLE_SOLID
#property indicator_width4  1
//--- input parameters
input int   period_1=20;
input int   period_2=10;
//--- indicator buffers
double         Upper1Buffer[];
double         Lower1Buffer[];
double         Upper2Buffer[];
double         Lower2Buffer[];

int rslt = 0;
//+------------------------------------------------------------------+
//| Custom indicator initialization function                         |
//+------------------------------------------------------------------+
int OnInit()
  {
//--- indicator buffers mapping
   SetIndexBuffer(0,Upper1Buffer,INDICATOR_DATA);
   SetIndexBuffer(1,Lower1Buffer,INDICATOR_DATA);
   SetIndexBuffer(2,Upper2Buffer,INDICATOR_DATA);
   SetIndexBuffer(3,Lower2Buffer,INDICATOR_DATA);

   PlotIndexSetString(0,PLOT_LABEL,"Bands_U1("+string(period_1)+") Upper");
   PlotIndexSetString(1,PLOT_LABEL,"Bands_L1("+string(period_1)+") Lower");
   PlotIndexSetString(2,PLOT_LABEL,"Bands_U2("+string(period_2)+") Upper");
   PlotIndexSetString(3,PLOT_LABEL,"Bands_L2("+string(period_2)+") Lower");

//---
   return(INIT_SUCCEEDED);
  }
//+------------------------------------------------------------------+
//| Custom indicator iteration function                              |
//+------------------------------------------------------------------+
int OnCalculate(const int rates_total,
                const int prev_calculated,
                const datetime &time[],
                const double &open[],
                const double &high[],
                const double &low[],
                const double &close[],
                const long &tick_volume[],
                const long &volume[],
                const int &spread[])
  {
//---
   int bars = iBars(NULL,PERIOD_CURRENT);

   for(int k=0; k<bars-20 && !IsStopped(); k++)
     {
      if(k > 0 && rslt > 0)
        {
         return(rates_total);
        }

      double Highest_period_1 = MathMax(iHigh(NULL,PERIOD_CURRENT,k),iHigh(NULL,PERIOD_CURRENT,k+1));
      for(int z = 2; z < period_1; z++)
        {
         Highest_period_1 = MathMax(Highest_period_1, iHigh(NULL,PERIOD_CURRENT,k+z));
        }
      double Highest_period_2 = MathMax(iHigh(NULL,PERIOD_CURRENT,k),iHigh(NULL,PERIOD_CURRENT,k+1));
      for(int z = 2; z < period_2; z++)
        {
         Highest_period_2 = MathMax(Highest_period_2, iHigh(NULL,PERIOD_CURRENT,k+z));
        }

      double Lowest_period_1 = MathMin(iLow(NULL,PERIOD_CURRENT,k),iLow(NULL,PERIOD_CURRENT,k+1));
      for(int z = 2; z < period_1; z++)
        {
         Lowest_period_1 = MathMin(Lowest_period_1, iLow(NULL,PERIOD_CURRENT,k+z));
        }
      double Lowest_period_2 = MathMin(iLow(NULL,PERIOD_CURRENT,k),iLow(NULL,PERIOD_CURRENT,k+1));
      for(int z = 2; z < period_2; z++)
        {
         Lowest_period_2 = MathMin(Lowest_period_2, iLow(NULL,PERIOD_CURRENT,k+z));
        }

      Upper1Buffer[bars - k - 1] = Highest_period_1;
      Upper2Buffer[bars - k - 1] = Highest_period_2;
      Lower1Buffer[bars - k - 1] = Lowest_period_1;
      Lower2Buffer[bars - k - 1] = Lowest_period_2;
     }
   rslt = prev_calculated;

//--- return value of prev_calculated for next call
   return(rates_total);
  }
//+------------------------------------------------------------------+
追記(2023/04/02)
ミドルラインを表示させたいという要望がありましたので、ミドルラインを表示させるコードを追記しておきます。
ミドルラインを表示させたい方はこちらをご使用ください。
//+------------------------------------------------------------------+
//|                                              DonchianChannel.mq5 |
//|                                            Copyright 2022, じゅにこ. |
//|                            https://coconala.com/services/2119358 |
//+------------------------------------------------------------------+
#property copyright "Copyright 2022, じゅにこ."
#property link      "https://coconala.com/services/2119358"
#property version   "1.00"
#property indicator_chart_window
#property indicator_buffers 6
#property indicator_plots   6
//--- plot Upper1
#property indicator_label1  "Upper1"
#property indicator_type1   DRAW_LINE
#property indicator_color1  clrDodgerBlue
#property indicator_style1  STYLE_SOLID
#property indicator_width1  1
//--- plot Lower1
#property indicator_label2  "Lower1"
#property indicator_type2   DRAW_LINE
#property indicator_color2  clrDodgerBlue
#property indicator_style2  STYLE_SOLID
#property indicator_width2  1
//--- plot Upper2
#property indicator_label3  "Upper2"
#property indicator_type3   DRAW_LINE
#property indicator_color3  clrIndianRed
#property indicator_style3  STYLE_SOLID
#property indicator_width3  1
//--- plot Lower2
#property indicator_label4  "Lower2"
#property indicator_type4   DRAW_LINE
#property indicator_color4  clrIndianRed
#property indicator_style4  STYLE_SOLID
#property indicator_width4  1
//--- plot Middle1
#property indicator_label5  "Middle1"
#property indicator_type5   DRAW_LINE
#property indicator_color5  clrWhite
#property indicator_style5  STYLE_DOT
#property indicator_width5  1
//--- plot Middle2
#property indicator_label6  "Middle2"
#property indicator_type6   DRAW_LINE
#property indicator_color6  clrGray
#property indicator_style6  STYLE_DOT
#property indicator_width6  1
//--- input parameters
input int   period_1=20;
input int   period_2=10;
//--- indicator buffers
double         Upper1Buffer[];
double         Lower1Buffer[];
double         Upper2Buffer[];
double         Lower2Buffer[];
double         Middle1Buffer[];
double         Middle2Buffer[];
int rslt = 0;
//+------------------------------------------------------------------+
//| Custom indicator initialization function                         |
//+------------------------------------------------------------------+
int OnInit()
  {
//--- indicator buffers mapping
   SetIndexBuffer(0,Upper1Buffer,INDICATOR_DATA);
   SetIndexBuffer(1,Lower1Buffer,INDICATOR_DATA);
   SetIndexBuffer(2,Upper2Buffer,INDICATOR_DATA);
   SetIndexBuffer(3,Lower2Buffer,INDICATOR_DATA);
   SetIndexBuffer(4,Middle1Buffer,INDICATOR_DATA);
   SetIndexBuffer(5,Middle2Buffer,INDICATOR_DATA);

   PlotIndexSetString(0,PLOT_LABEL,"Bands_U1("+string(period_1)+") Upper");
   PlotIndexSetString(1,PLOT_LABEL,"Bands_L1("+string(period_1)+") Lower");
   PlotIndexSetString(2,PLOT_LABEL,"Bands_U2("+string(period_2)+") Upper");
   PlotIndexSetString(3,PLOT_LABEL,"Bands_L2("+string(period_2)+") Lower");
   PlotIndexSetString(4,PLOT_LABEL,"Bands_M1("+string(period_1)+") Middle");
   PlotIndexSetString(5,PLOT_LABEL,"Bands_M2("+string(period_2)+") Middle");

//---
   return(INIT_SUCCEEDED);
  }
//+------------------------------------------------------------------+
//| Custom indicator iteration function                              |
//+------------------------------------------------------------------+
int OnCalculate(const int rates_total,
                const int prev_calculated,
                const datetime &time[],
                const double &open[],
                const double &high[],
                const double &low[],
                const double &close[],
                const long &tick_volume[],
                const long &volume[],
                const int &spread[])
  {
//---
   int bars = iBars(NULL,PERIOD_CURRENT);

   for(int k=0; k<bars-20 && !IsStopped(); k++)
     {
      if(k > 0 && rslt > 0)
        {
         return(rates_total);
        }

      double Highest_period_1 = MathMax(iHigh(NULL,PERIOD_CURRENT,k),iHigh(NULL,PERIOD_CURRENT,k+1));
      for(int z = 2; z < period_1; z++)
        {
         Highest_period_1 = MathMax(Highest_period_1, iHigh(NULL,PERIOD_CURRENT,k+z));
        }
      double Highest_period_2 = MathMax(iHigh(NULL,PERIOD_CURRENT,k),iHigh(NULL,PERIOD_CURRENT,k+1));
      for(int z = 2; z < period_2; z++)
        {
         Highest_period_2 = MathMax(Highest_period_2, iHigh(NULL,PERIOD_CURRENT,k+z));
        }

      double Lowest_period_1 = MathMin(iLow(NULL,PERIOD_CURRENT,k),iLow(NULL,PERIOD_CURRENT,k+1));
      for(int z = 2; z < period_1; z++)
        {
         Lowest_period_1 = MathMin(Lowest_period_1, iLow(NULL,PERIOD_CURRENT,k+z));
        }
      double Lowest_period_2 = MathMin(iLow(NULL,PERIOD_CURRENT,k),iLow(NULL,PERIOD_CURRENT,k+1));
      for(int z = 2; z < period_2; z++)
        {
         Lowest_period_2 = MathMin(Lowest_period_2, iLow(NULL,PERIOD_CURRENT,k+z));
        }

      Upper1Buffer[bars - k - 1] = Highest_period_1;
      Upper2Buffer[bars - k - 1] = Highest_period_2;
      Lower1Buffer[bars - k - 1] = Lowest_period_1;
      Lower2Buffer[bars - k - 1] = Lowest_period_2;

      Middle1Buffer[bars - k - 1] = (Upper1Buffer[bars - k - 1] + Lower1Buffer[bars - k - 1])/2;
      Middle2Buffer[bars - k - 1] = (Upper2Buffer[bars - k - 1] + Lower2Buffer[bars - k - 1])/2;
     }
   rslt = prev_calculated;

//--- return value of prev_calculated for next call
   return(rates_total);
  }
//+------------------------------------------------------------------+