
Python:CSVファイルからグラフを生成してHTMLファイルに出力する

Pythonにて、以下の処理を行います。
事前準備:CSVファイルを任意のファイル名で作成します。
1.ファイルダイアログからCSVファイルを選択します。
2.グラフを生成します。
3.ファイルダイアログで出力するHTMLファイル名を入力して、HTMLファイルに出力して、起動します。
CSVファイルのサンプルです。
※Pythonで実行してエラーが出るときは文字コードに注意してください。おそらく「UTF-8(BOM無)」で保存していれば実行できるはずです。
名前,年齢,性別,給与
Alice,30,女性,3000
Bob,25,男性,2500
Charlie,35,男性,1500
Pythonのソースサンプルです。
import pandas as pd
import plotly.express as px
import tkinter as tk
from tkinter import filedialog
import os
import webbrowser
def select_file_dialog():
root = tk.Tk()
root.withdraw()
file_path = filedialog.askopenfilename(filetypes=[("CSV files", "*.csv")])
return file_path
def save_file_dialog():
root = tk.Tk()
root.withdraw()
file_path = filedialog.asksaveasfilename(defaultextension=".html", filetypes=[("HTML files", "*.html")])
return file_path
def main():
# CSVファイルの選択
csv_file_path = select_file_dialog()
if not csv_file_path:
print("CSVファイルが選択されませんでした。")
return
# CSVファイルの読み込み
df = pd.read_csv(csv_file_path)
if df.empty:
print("CSVファイルが空です。")
return
print(df.info())
# グラフの生成
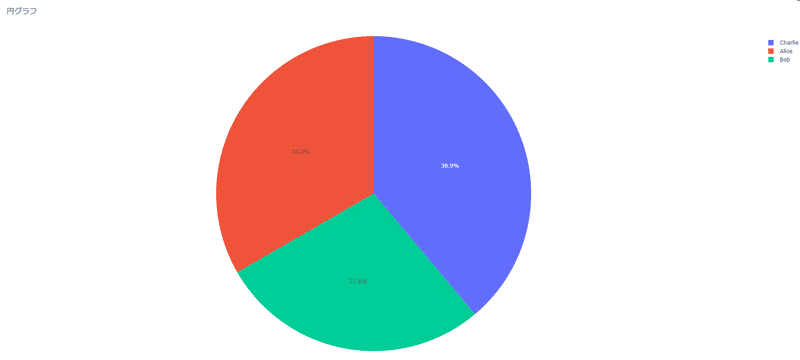
pie_fig = px.pie(df, names=df.columns[0], values=df.columns[1], title="円グラフ")
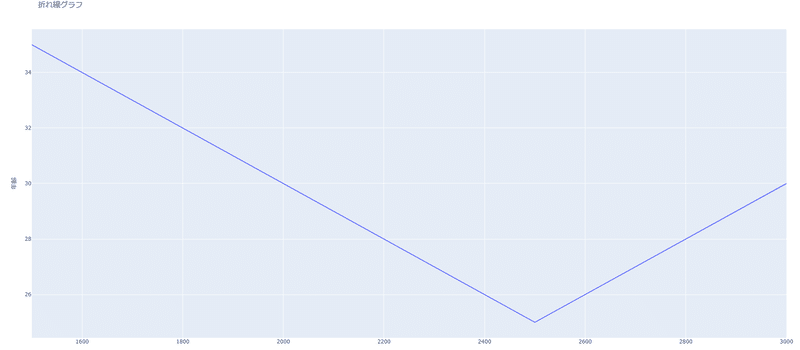
line_fig = px.line(df, x=df.columns[3], y=df.columns[1], title="折れ線グラフ")
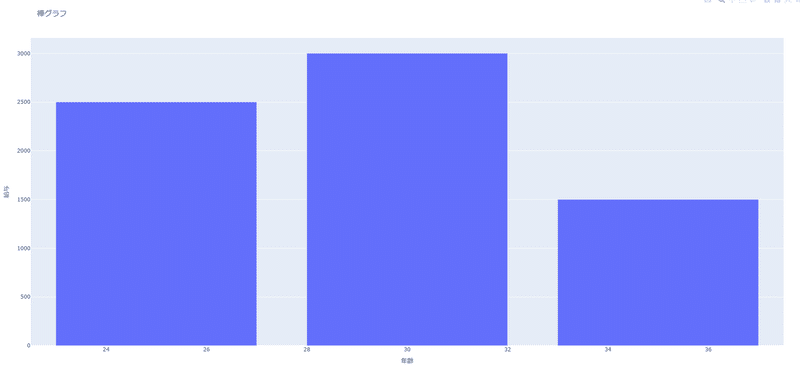
bar_fig = px.bar(df, x=df.columns[1], y=df.columns[3], title="棒グラフ")
# HTMLファイルの保存場所を選択
output_file_path = save_file_dialog()
if not output_file_path:
print("保存先が選択されませんでした。")
return
# HTMLファイルにグラフを出力
with open(output_file_path, 'w', encoding='utf-8') as f:
f.write(f"<html><head><meta charset='utf-8'></head><body>")
f.write(pie_fig.to_html(full_html=False, include_plotlyjs='cdn'))
f.write(line_fig.to_html(full_html=False, include_plotlyjs='cdn'))
f.write(bar_fig.to_html(full_html=False, include_plotlyjs='cdn'))
f.write("</body></html>")
print(f"グラフが{output_file_path}に保存されました。")
webbrowser.open(output_file_path)
if __name__ == "__main__":
main()独自のCSVファイルを選択した場合は
    # グラフの生成
    pie_fig = px.pie(df, names=df.columns[0], values=df.columns[1], title="円グラフ")
    line_fig = px.line(df, x=df.columns[3], y=df.columns[1], title="折れ線グラフ")
    bar_fig = px.bar(df, x=df.columns[1], y=df.columns[3], title="棒グラフ")
でエラーになると思います。
(特に「折れ線グラフ」「棒グラフ」)
数字型のカラムを指定し直してください。
※一番左の先頭カラム位置は「0」です。
サンプルCSVをグラフ化した場合、以下のようになります。
2024/05/26追記
上記の記事が意外と読まれているのでバージョンアップしました。
以下を参照してください。
この記事が気に入ったらサポートをしてみませんか?