フットボール統計学 攻撃貢献を評価するボール前進モデル

February 21, 2019
Attacking Contributions: Markov Models for Football - StatsBomb
By Derrick Yam
Messi or Ronaldo? Kroos or Modric? Mbappe or Neymar? Every football fan loves to argue over who they think is a better player. Depending on where your loyalties lie, arguments can range from simple statistics; like the number of goals they’ve scored or the trophies they have won, to advanced metrics like expected goal values from ghosting. To the layman football fan, the former argument is almost certainly more digestible. But for the rest of us, we often want a metric that’s more objective, more extendable, and more rigorous, while still being able to understand it and explain it to your counterpart to assert your football dominance.
メッシかロナウドか。クロースかモドリッチか。エムバペかネイマールか。すべてのフットボールファンは、より良い選手について議論するのが好きである。忠誠心がどこにあるかに依存して、議論は得点数や獲得したトロフィー数など単純な統計から、得点期待値のような高度な指標もある。素人のフットボールのファンにとって、前者の議論はほぼ確実により消化しやすい。しかし他にとって、より客観的でより拡張性があり、より厳密な指標を求めており、まだフットボールの優位性を主張するために相手にそれを理解し、それを説明することができる。
The evolution of football analytics – how we got to non-shot expected goals models.
Every football analytics nerd understands the (slow) evolution of football statistics. The story begins with football’s notorious and frustratingly difficult objective of scoring goals, the historic hindrance for American spectating. Analyzing goals scored and goals conceded appeased few and people quickly realized the value of shot volume for depicting a team’s performance and ability. The obvious pitfall in comparing shot volume was the quality of a shot can vary drastically. This led to everyone under the sun defining their own expected goals (xG) model to objectify chance quality and aggregate goal likelihood as a better metric for attacking production. xG is now omnipresent in football analytics as a tool for attackers’ and teams’ performance. Most recently in the sports analytics community, people have extended the concept of expected goals to allocate ball progression contributions throughout a team’s possession of the ball.
すべてのフットボール分析オタクはフットボール統計学の(遅い)進化を理解している。物語は、ゴールを決めるというフットボールの悪名高く苛立たしく難しい目的、アメリカの観客にとって歴史的な障害から始まる。得点や失点の分析はほとんど行われず、チームのパフォーマンスと能力を表現するためのシュート数の価値をすぐに実感した。シュート数を比較する際の明らかな落とし穴は、ショットの質が劇的に異なる可能性があることだった。これにより、チャンスの質を明確化し、ゴールの可能性を集計して攻撃の成果のより良い基準として、独自のxGモデルを定義した。xGは現在、アタッカーやチームのパフォーマンスを向上させるツールとして、フットボール分析では遍在している。ごく最近スポーツ分析業界では、xGの概念を拡張し、チームのボールポゼッションを通してボール前進での貢献を割り当てている。
Commonly referred to as “non-shot expected goals (NSxG) models”, these models are effective tools to quantify passes and carries into dangerous areas of the pitch, assigning value to actions other than shots and allowing for the comparison of attacking contribution of ALL players. Fivethirtyeight even uses a non-shot xG model as a component in their soccer projections.
一般に「非シュート得点期待値(NSxG)モデル」と呼ばれるこれらのモデルは、パスやピッチの危険な領域への持ち込みを定量化する有効なツールであり、シュート以外のアクションに価値を割り当て、すべての選手の攻撃的貢献の比較を可能にする。Fivethirtyeightは、フットボール予想の構成要素としてさえNSxGモデルを使用する。
The original research – before “non-shot expected goals” became a thing – was by Sarah Rudd, presented at NESSIS in 2011. Rudd used Markov models to assign individuals offensive production values defined as the change in the probability of a possession ending in a goal from the previous state of possession to the current state of possession.
当初の研究は、「NSxG」が問題になる前、2011年にNESSISで発表されたSarah Rudd氏によるものだった。Rudd氏はマルコフモデルを使用して、前のポゼッション状態から現在のポゼッション状態へのゴールで終了する確率の変化として定義された、個人の攻撃の出来高を割り当てた。
For example, imagine a player standing 30 yards from the goal line, close to the sideline. They are in a non-threatening position and that possession will rarely result in a goal. Let’s say it has a 1% chance of resulting in a goal. Now, that player gets a cross off, the defender clears it out of bounds for a corner kick. Corner kicks resulted in goals approximately 4% of the time. This play would attribute a +3% change in NSxG for the player who crossed the ball.
例えば、タッチライン際でゴールラインから30ヤード離れたところに立っている選手を想像する。脅威的な位置にはなく、そのポゼッションによって得点になることはめったにない。1%の確率で得点するとする。さて、その選手はクロスを上げ、DFはしてCKとなる。CKだと、約4%でゴールとなる。このプレーは、クロスを上げた選手のNSxGの+3%の変化と考えられる。
As data becomes increasingly utilized and accessible, the variants of NSxG models grow just as xG models did. Mark Taylor further explains NSxG models here. Nils Mackay defines “xG added” to grade passing skill and extends it to allocate value for carries and structures as a possession based model. Similarly (and most recently), Karun Singh published his version of xG added, introducing xG threat, explaining it with beautiful interactive visualizations.
データがますます利用されアクセス可能になるにつれて、NSxGモデルの変形はxGモデルと同じように大きくなる。Mark Taylor氏がさらにNSxGモデルについて説明している。Nils Mackay氏はパススキル評価に「xG added」を定義し、ポゼッションベースのモデルとして前進と構造に価値を割り当てるようにそれを拡張する。同様に(そして最近)、Karun Singh氏が脅威期待値(xT)を紹介し、それを美しい対話式な視覚化で説明した。
All of this publicly facing research has been pivotal in advancing the applications and effectiveness of sports analytics. Today, I am going to walk through a tutorial on StatsBomb’s first iteration of a Ball Progression Model. I like to refer to NSxG as “contribution”, simply because it’s easier to say and not everything in football analytics needs an “x” in it.
この公的に面した研究はすべて、スポーツ分析の適用と有効性を向上させる上で極めて重要である。今回StatsBombによるボール前進モデルの最初の反復についてのチュートリアルを進める。NSxGを「貢献」と呼びたいが、それは簡単で、フットボール分析のすべてに「x」が必要なわけではないためである。
Markov Model – Framework and Methodology.
Adopting the framework set forth by Rudd, we construct a possession based Markov model we call our “Ball Progression Model”. We define attacking possessions to have two possible outcomes, a Goal or a Turnover. In a Markov model, these two outcomes are known as the “absorption states”. The most crucial condition of an absorption state is that the probability of transitioning out of the state is 0 and the probability of remaining in the state is 1, given that it is the end of a possession this condition holds and the data must be structured as such (this condition makes it more difficult to consider shots or xG bins as potential absorption states). Leading up to the absorption state, a possession can transition between any number of “transient states”. We define transient states based on the context of the state and the geographical location of the possession at a current state. Extending the states defined by Rudd and applying to StatsBomb data, we define the following context-based transient states:
Rudd氏が提示したフレームワークを採用して、「ボール前進モデル」と呼ぶポゼッションベースのマルコフモデルを構築する。ポゼッションを2つの可能な結果、ゴールまたはターンオーバーを持つと定義する。マルコフモデルでは、これら2つの結果は「吸収状態」として知られる。吸収状態の最も重要な条件は、状態から遷移する確率が0で、状態に留まる確率が1であることであり、それがこの条件が成立するポゼッションの終了であり、データがそのように構成されていなければならないことを考える(この条件はシュートまたはxGを潜在的な吸収状態と見なすことをより困難にする)。
- Attacking Third Free Kick
- Central Third Free Kick
- Defending Third Free Kick
- Attacking Third Throw In
- Central Third Throw In
- Defending Third Throw In
- Corner Kick
- Penalty Won
- アタッキングサードでのフリーキック
- ミドルサードでのフリーキック
- ディフェンシブサードでのフリーキック
- アタッキングサードでのスローイン
- ミドルサードでのスローイン
- ディフェンシブサードでのスローイン
- コーナーキック
- ペナルティ奪取
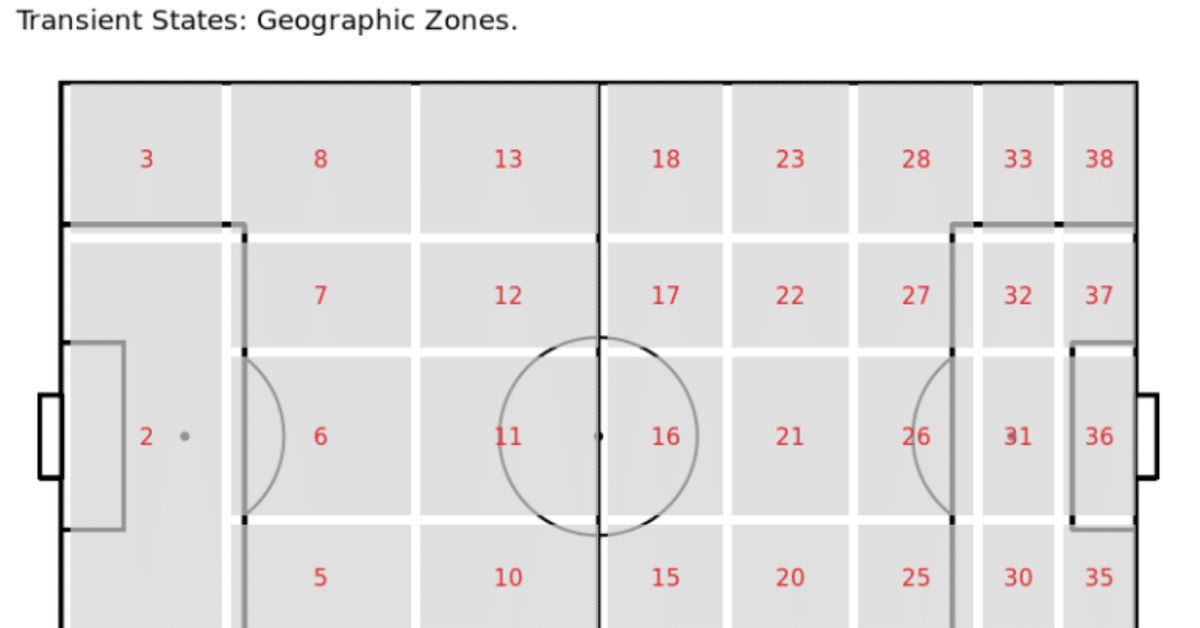
We then define the following geographic zones as transient states:
次に、以下の地理的ゾーンを遷移状態として定義する。
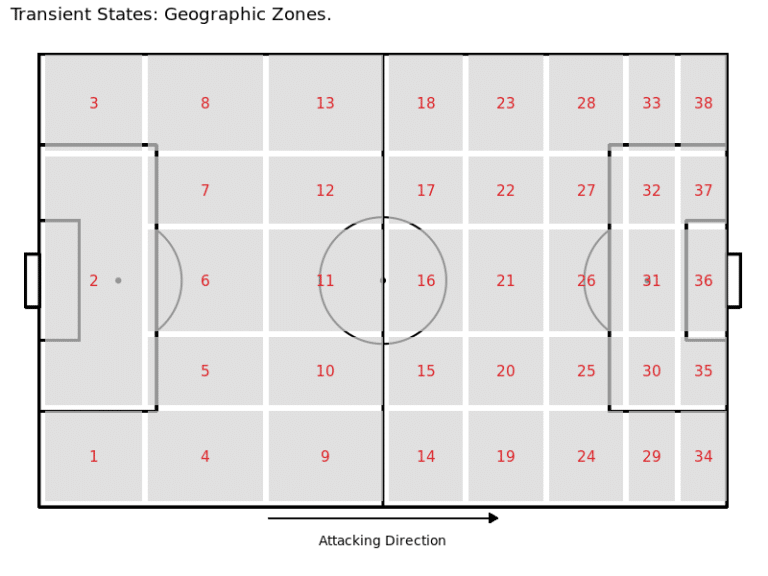
Since a state can depend greatly on defensive pressure, we define the geographic zones each when they are absent of pressure and when they are under pressure. This leaves us with 76 geographic zones (38 with pressure, 38 without pressure) and 8 contextual zones for a total of 84 transient states.
状態は守備的圧力に大きく依存する可能性があるため、地理的ゾーンを圧力無しと圧力有りにそれぞれ定義する。これにより、76の地理的ゾーン(38の圧力有り、38の圧力無し)と8つの文脈ゾーンがあり、合計84の遷移状態になる。
Transient states can transition between other transient states and ultimately an absorption state based on some observed transition probability. The transition probability is dependent only on the current state of the possession and is independent of previous states. This is known as the Markov property and is a key assumption in Markov models (in the discussion we consider this a limitation and propose extensions to this property). For instance, if you have the ball in zone 21, the probability that you pass the ball to zone 28 is the same regardless of the fact that the ball came from zone 14 as opposed to any other zone. This is known as the “memoryless” property.
遷移状態は、観測された遷移確率に基づき、他の過渡状態と最終的な吸収状態との間で遷移する可能性がある。遷移確率は現在のポゼッション状態にのみ依存し、以前の状態からは独立している。これはマルコフ性として知られており、マルコフモデルにおける重要な仮定である(議論においてこれを制限と考え、この特性への拡張を提案する)。たとえば、ボールがゾーン14や他のゾーンから来たという事実にかかわらず、ボールがゾーン21にある場合、ボールをゾーン28に渡す確率は同じである。これは「無記憶」性として知られる。
Quick notation – n is the number of transient states (in our case 84), r is the number of absorbing states (in our case 2). Q is the matrix of transition probabilities, Q is n x n. R is the matrix of absorption probabilities, R is n x r. N is known as the fundamental matrix and it is calculated as the inverse to the n x n identity matrix, I, minus the transition matrix Q, formally N = (I – Q)^-1.
簡単な表記法:nは遷移状態数(この場合84)、rは吸収状態数(この場合2)である。Qは遷移確率行列で、n x n型である。Rは吸収確率行列で、n x r型である。Nは基本行列として知られ、n x n型の単位行列Iから遷移確率行列Qを引いたものの逆行列、形式的にはN = (I – Q)^-1として計算される。
Calculations – for each transient state, we can calculate the expected number of plays (progressing actions: passes, carries, and shots) until absorption as the row sums of the fundamental matrix. Then, the probability of reaching either absorption state for the current transient state is equal to N x R. For more on the theory behind Markov models, please see here. Special thanks to Ron Yurko for the code.
計算:遷移状態ごとに、吸収までのプレー数の期待値(進行中のアクション:パス、前進、およびシュート)を、基本行列の行合計として計算される。それで、現在の遷移状態からどちらかの吸収状態に達する確率は、N×Rに等しい。マルコフモデルの背後にある理論の詳細については、こちらを参照する。コードを提供してくれたRon Yurko氏に感謝する。
Results
We prepare the data (this is the most time consuming portion) and run our ball progression model for Europe’s big five leagues, England Championship and England League One for the 2017/2018 and 2018/2019 (through 2/18/19) seasons.
ヨーロッパの5大リーグ、イングランドチャンピオンシップ、イングランドリーグワンの2017/2018と2018/2019(2/18/19まで)のシーズンについて、データを準備し(これは最も時間のかかる部分である)、ボール前進モデルを実行する。
For each transient state, we calculate the probability of a goal in absorption as well as the expected number of plays until absorption. The three most likely states to result in a goal are (refer to geographic zones above): 36 w/ pressure (Pr(Goal) = 19.2%), 31 w/ pressure (Pr(Goal) = 9%), and 36 w/o pressure (Pr(Goal) = 8.3%). The three most likely zones to result in a turnover are: 1 w/ pressure (Pr(Turnover) = 99.5%), 3 w/ pressure (Pr(Turnover) = 99.5%), and 2 w/ pressure (Pr(Turnover) = 99.5%). We present a possession that resulted in a goal below, with the contribution value for each action.
遷移状態ごとに、吸収状態の得点の確率と吸収までのプレー数の期待値を計算する。得点となる可能性が最も高い3状態は次の通りである(上記の地理的ゾーンを参照)。ゾーン36プレッシャー有り(得点確率19.2%)、ゾーン31プレッシャー有り(得点確率9%)、ゾーン36プレッシャー無し(得点確率8.3%)。ターンオーバーとなる可能性が最も高い3状態は次の通りである。ゾーン1プレッシャー有り(ターンオーバー確率99.5%)、ゾーン3プレッシャー有り(ターンオーバー確率99.5%)、ゾーン2プレッシャー有り(ターンオーバー確率99.5%)。各アクションの貢献価値とともに、以下の得点したポゼッションを提示する。
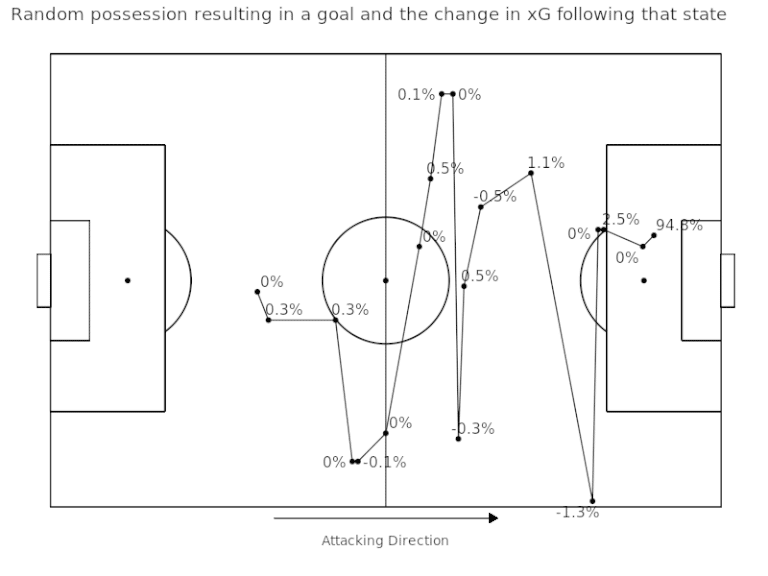
We then calculate our “contribution” metric as the change in the probability of a goal from the current state to the next state. Formally,
次に、現在の状態から次の状態への得点確率の変化として、「貢献」指標を計算する。正式には、
contribution = Pr(Goal|State(t+1)) – Pr(Goal|State(t))
for each transient state at time t.
時刻tにおける各遷移状態について
(貢献)=(t+1における状態の下での得点の条件付き確率)
-(tにおける状態の下での得点の条件付き確率)
We can also calculate total attacking contributions for each individual, i, as the sum of all of their attacking contributions,
また各個人iの攻撃への貢献の合計を計算できる。
contribution(i) = ∑Pr(Goal|State(t+1)) – Pr(Goal|State(t))i ·I(action by player i)
(iの貢献)=(iによるアクションの貢献の合計)
We then scale their total contribution by the number of matches played to get a player’s “contribution per game”.
次に、選手の「1試合あたりの貢献」を得るために、プレーした試合数で合計貢献を評価する。
We choose to leave the contribution per game metric raw, not standardizing by league strength. This is to simply to see the crude output from the model, giving every player a fair chance to shine regardless of where they play. The top five contributors for each position (attackers, midfielders, defenders and goalkeepers) are presented in the tables below:
リーグの強さで標準化するのではなく、1試合あたりの貢献度をそのままにすることを選択する。これは単にモデルからの大まかなアウトプットを見ることであり、すべての選手がどこでプレーするかにかかわらず輝くチャンスを公平に与える。各ポジションの上位5人の貢献者(FW、MF、DF、GK)を以下の表に示す。
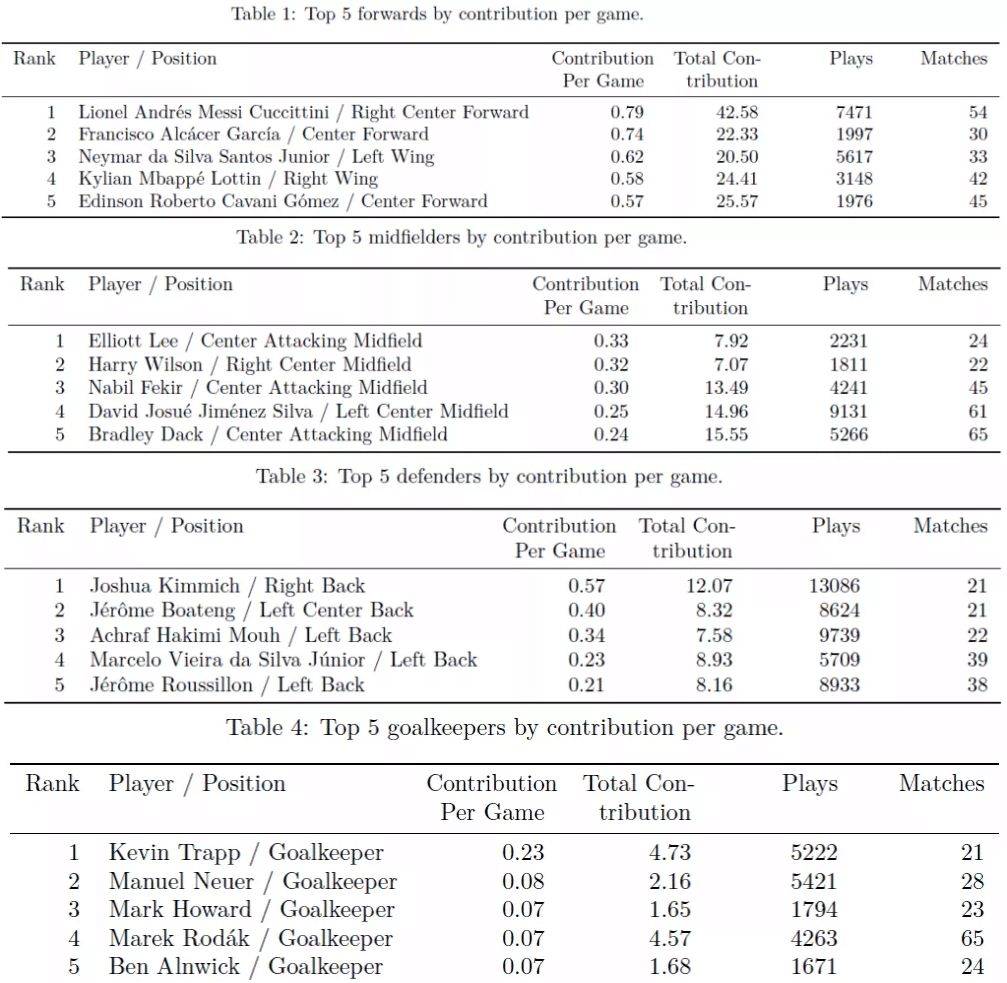
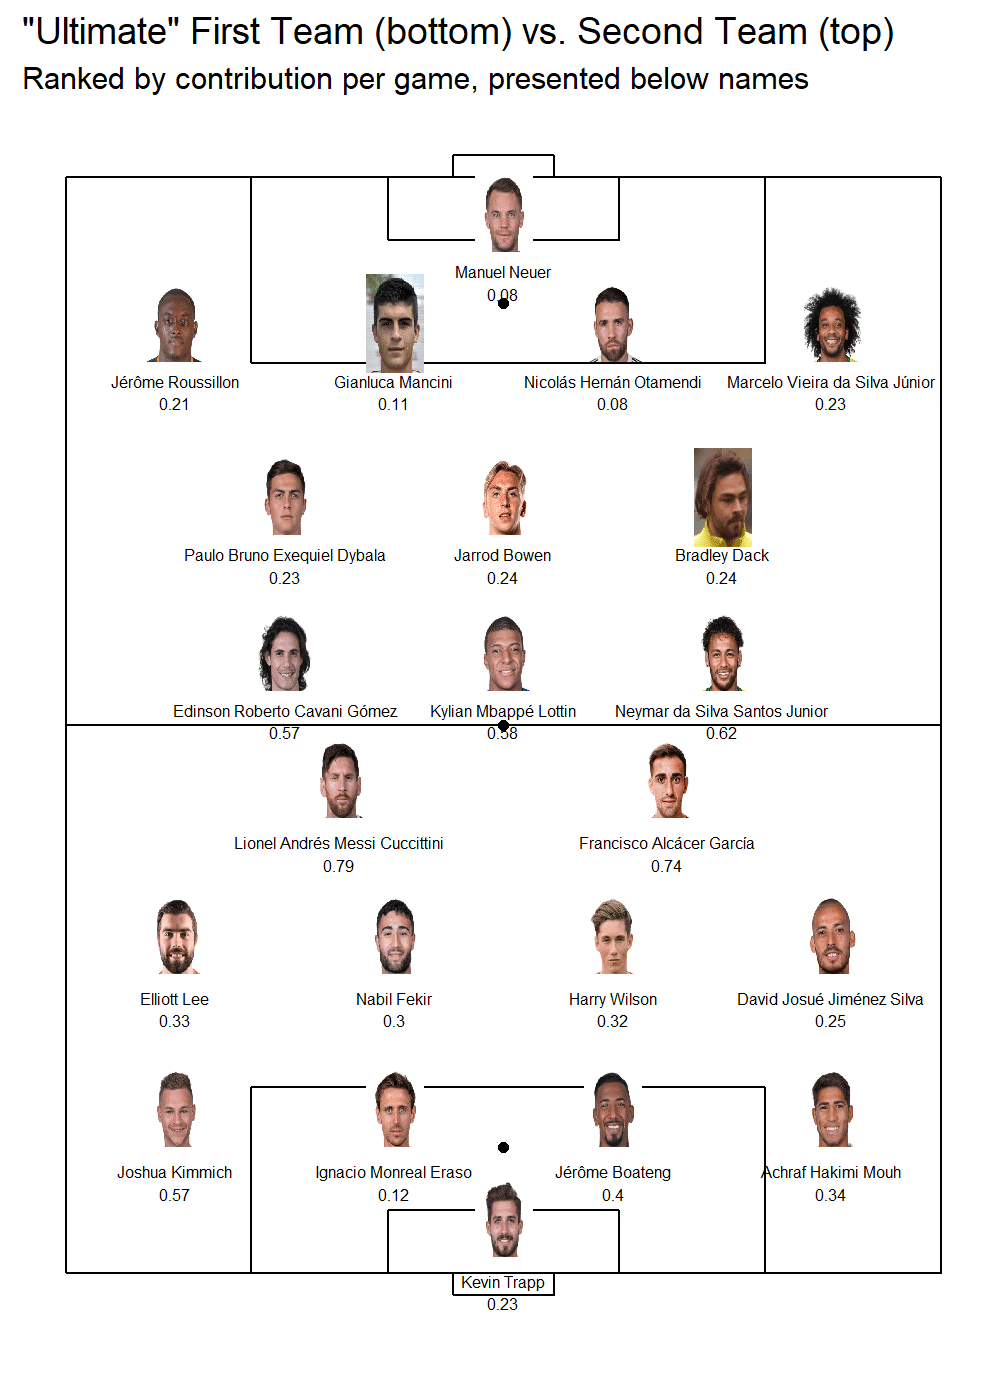
We also formulate a hypothetical “Ultimate Team” for the top contributors for each position of a standard 4-4-2 against a 4-3-3. Again, we purposely make the naive assumption that contributions between different leagues are equal. We also, in order to show you some names you might know, purposely didn’t stress that the ultimate teams are extremely broad and unrealistic when it comes to positional categorizations. The two squads we formulate highlight plenty of young stars to remember during the next transfer window.
また標準の4-4-2対4-3-3の各ポジションの上位の貢献者「究極のチーム」仮説を定式化する。繰り返すが、私たちは故意に異なるリーグ間の貢献は等しいという素朴な仮定をする。また、知り得る名前を見せるために、究極のチームが極端に幅広く、位置的な分類に関して非現実的であることを意図的に強調しなかった。策定した2チームは、次の移籍市場の間に覚えておくべきたくさんの若手を強調する。
Discussion
Our ball progression model has clearly identified the top players across Europe, and offers some justification for the money needed to acquire them. We have clearly designed a model that is easily interpretable even by the less-technical analytics sides. And ultimately, the model works without much computational power. Markov models are good at handling sequences of arbitrary length (as possessions in soccer can be anywhere from one event to 100s of events), and they allow for the attribution of final outcome contributions further along in the sequence.
ボール前進モデルはヨーロッパ中でトップ選手を明確に識別しており、彼らを獲得するのに必要とされるお金についていくらかの正当化を提供する。あまり技術的でない分析でも簡単に解釈できるモデルを明確に設計した。そして最終的に、このモデルはそれほど計算能力がなくても機能する。マルコフモデルは任意の長さのポゼッション連鎖を扱うのが得意であり(フットボールのポゼッションは1つから何百ものイベントまでどこにでもある可能性があるため)、ポゼッション連鎖の中でさらに最終成果の貢献の帰属を可能にする。
Nonetheless, there exist several limitations to a simple Markov model.
- First, Markov models’ assume the “memoryless” property when in reality a soccer possession is not memoryless. The probability of scoring when you are in a current state can depend on previous passes and carries leading up to the current state.
--- A further extension of our ball progression model, that would appease this limitation, is higher order Markov models. In higher order Markov models, instead of assuming the Markov property of independence, you assume that transition probabilities are conditionally independent based on the value of the current state and the value of the previous, 2nd previous, nth previous state, where the number of previous states you consider is the nth order of the Markov model.
- Another limitation is that this simple Markov model does not consider the action required to transition between states. For instance, the probability of a possession resulting in a goal may be different given that you passed into a zone vs. dribbled into a zone.
--- This limitation can be appeased with Markov decision processes, in which you consider the action at each state and time step, some examples of Markov decision processes in other sports can be found here, here, and here.
- Lastly, and perhaps the most obvious limitation of this Markov model is the categorized structure of transient and absorption states. This causes the loss of information and limits applications especially in the free-flowing game of football.
--- There exists some methods for continuous stochastic processes, but their use in the public sphere is limited and the concepts are far more difficult to understand.
とは言え、単純なマルコフモデルにはいくつかの制限がある。
- 第一に、マルコフモデルは、実際にフットボールのポゼッションは無記憶ではないが「無記憶」性を仮定する。現在の状態の得点確率は、現在の状態に至るまでのパスと前進に依存する。
--- この制限を緩和するボール前進モデルのさらなる拡張は、高次マルコフモデルである。高階マルコフモデルでは、マルコフの独立性を仮定する代わりに、遷移確率は現在の状態の値と前の状態、2つ前の状態、n個前の状態の値に基づいて条件付き独立を仮定し、ここで考慮する以前の状態の数はn階マルコフモデルである。
- 別の制限は、この単純なマルコフモデルは状態間の遷移に必要なアクションを考慮していないことである。例えば、あるゾーンへパスもしくはドリブルで移動するのを考えて、ポゼッションが得点となる可能性は異なる。
--- この制限は、各状態と時間ステップでの動作を考慮するマルコフ決定過程では緩和でき、他のスポーツでのマルコフ決定過程の例は、ここ、ここ、およびここにある。
- 最後に、そしておそらくこのマルコフモデルの最も明白な制限は、遷移状態と吸収状態の分類された構造である。これは情報の損失を引き起こし、特にフットボールの自由に流れる試合において応用を制限する。
--- 連続確率過程の方法がいくつか存在するが、公共の場でのそれらの使用は制限されており、概念は理解するのがはるかに難しい。
This leads us to StatsBomb’s latest endeavor. Based on the limitations outlined above, we recognized the need for a model that accounts for the continuous nature of football, the retention of information from previous states, and the actions chosen by decision makers. Our next model will improve on the limitations noted above as well as layer on additional components essential to a football team’s success such as the timing of goals and the style of play under different game states.
これはStatsBombの最新の試行を導く。上記で概説した制限に基づき、フットボールの連続的な性質、以前の状態からの情報の保持、そして意思決定者が選んだアクションを説明するモデルの必要性を認識した。次のモデルは、上記の制限を改善するとともに、ゴールのタイミングやさまざまな試合状態でのプレースタイルなど、フットボールチームの成功に不可欠な追加構成要素の層を追加する。
This will be the primary model we use for holistic ball progression in player and team stats, and a white paper detailing the model will be made available to current StatsBomb customers in March.
これが選手とチームの統計における全体的なボール前進に使用する主要なモデルになり、そしてモデルを詳述した白書は3月に現在のStatsBombの顧客に利用可能になるだろう。
ここから先は
¥ 100
#フットボール統計学