Python3エンジニア認定データ分析試験

1月にエンジニア認定基礎試験に合格したのでデータ分析試験にも挑戦しようと思います。


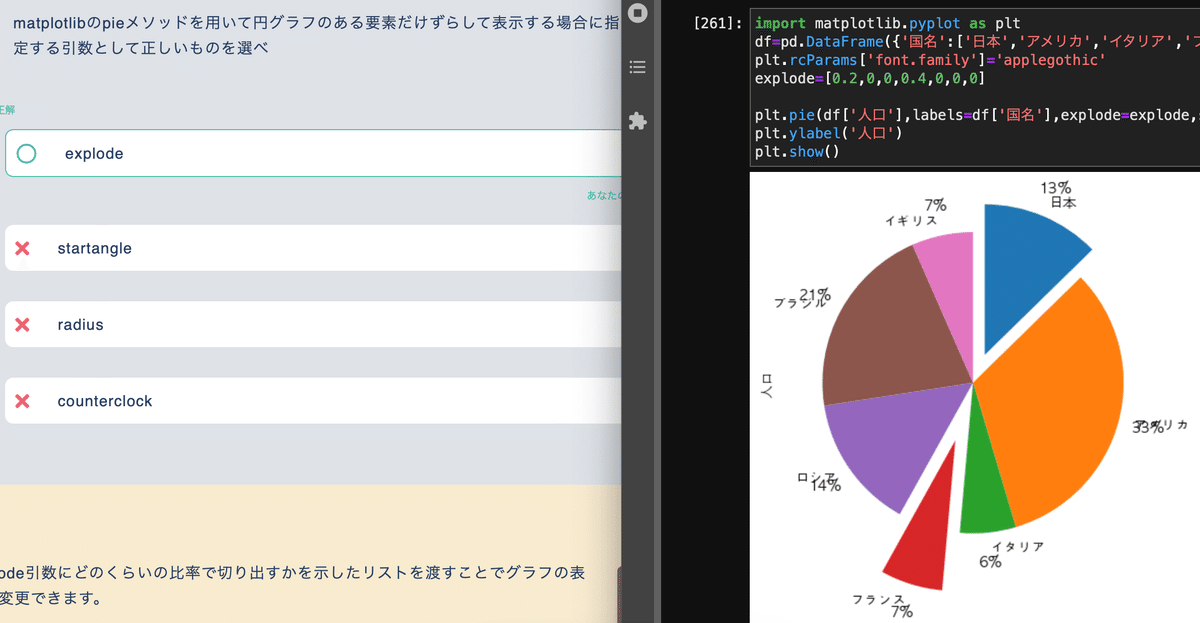
import matplotlib.pyplot as plt
df=pd.DataFrame({'国名':['日本','アメリカ','イタリア','フランス','ロシア','ブラジル','イギリス'],'人口':[12700,32800,6000,6700,14500,20900,6600]})
plt.rcParams['font.family']='applegothic'

plt.pie(df['人口'],labels=df['国名'],startangle=90,autopct='%1.0f%%',pctdistance=1.2)
plt.ylabel('人口')
plt.show()


import math

x_list=[i for i in range(10)]
y_list=list(map(lambda x:x**2,x_list))
y_list2=list(map(lambda x:x**3+x**2,x_list))
y_list3=list(map(lambda x:(math.e)**x,x_list))

plt.plot(x_list,y_list)
plt.plot(x_list,y_list2,label='x**3+x**2')
plt.plot(x_list,y_list3,label='exp(x)')
plt.legend()
plt.show()


この記事が気に入ったらサポートをしてみませんか?