HSB円柱モデル

関連
円柱モデル
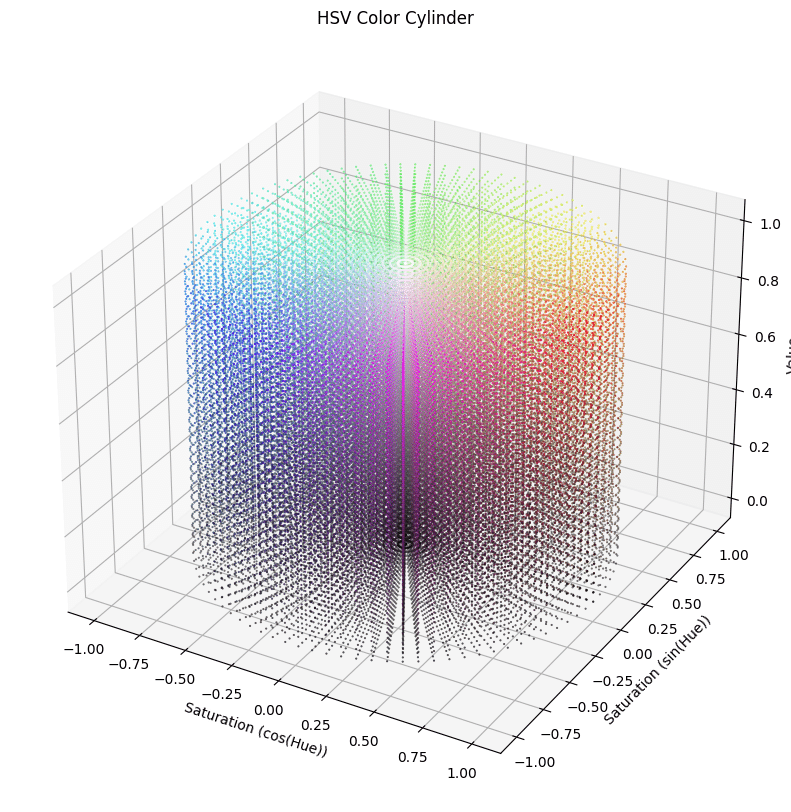
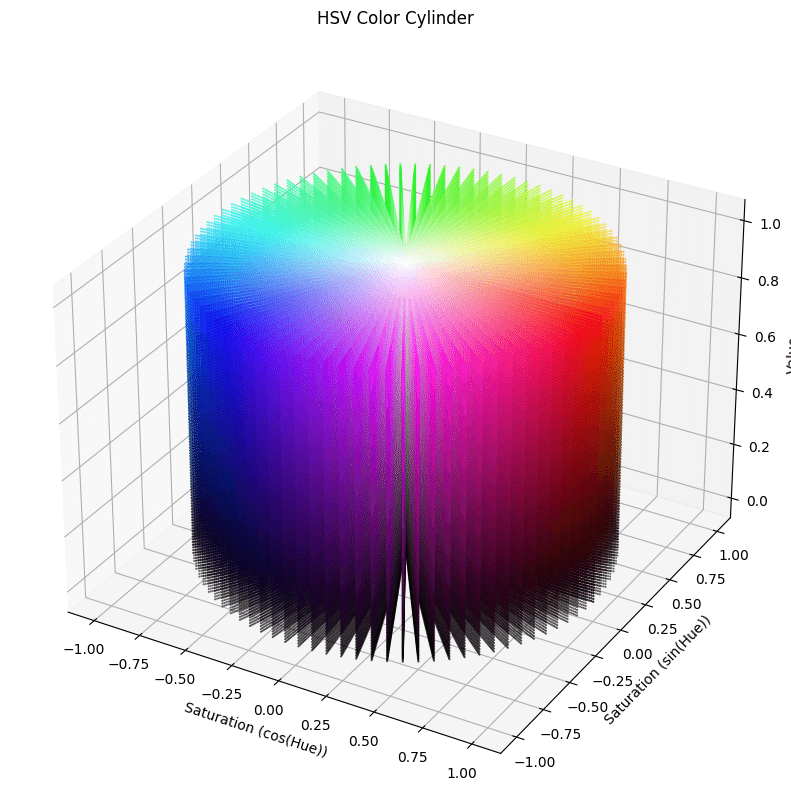
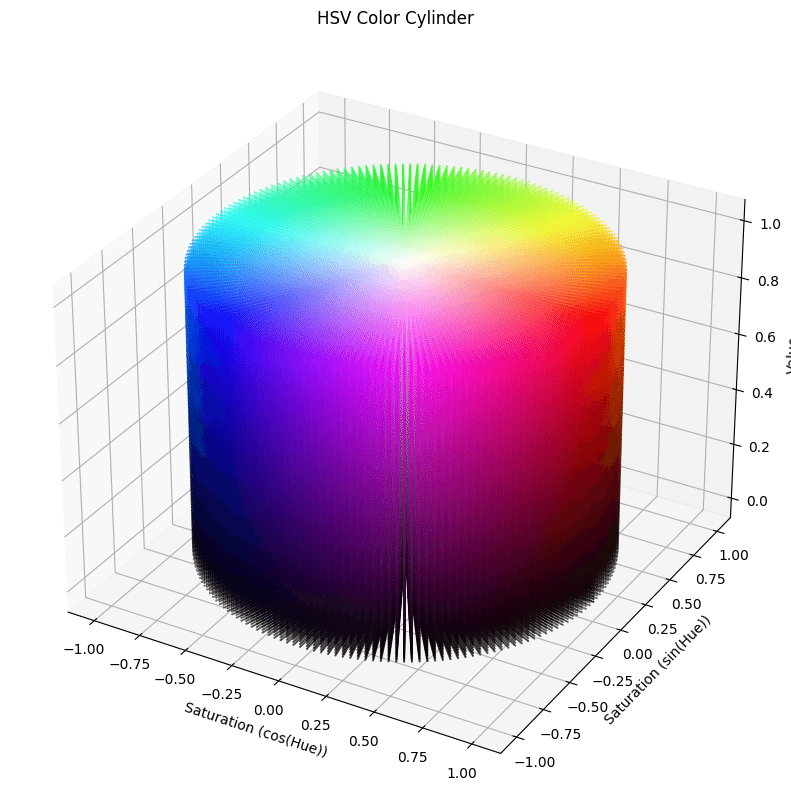
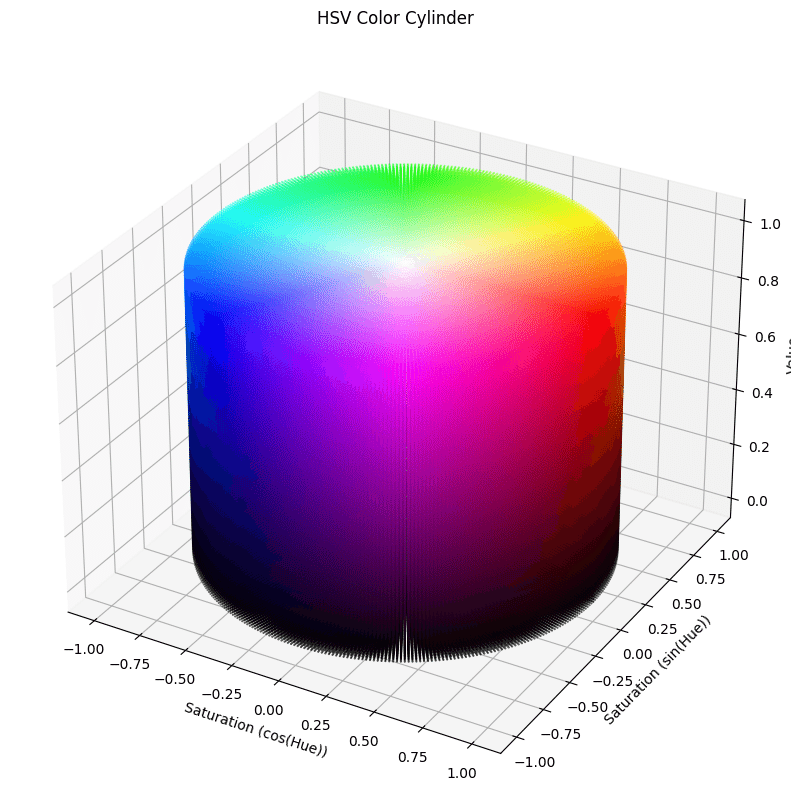
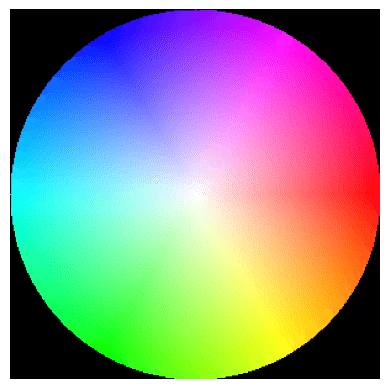
HSVやHSBの概念を理解しやすくするために、以下のような円柱モデルがよく用いられます。
円柱の垂直軸(高さ): 明度(Value/Brightness)を示し、下から上に行くほど明るくなります。
円柱の周囲: 色相(Hue)を示し、円を一周すると0度から360度までの色相が表示されます。
円柱の半径方向: 彩度(Saturation)を示し、中心から外側に行くほど鮮やかになります。
このモデルは、色の三次元的な関係を視覚的に理解するのに役立ちます。
import numpy as np
import matplotlib.pyplot as plt
from matplotlib.colors import hsv_to_rgb
from mpl_toolkits.mplot3d import Axes3D

# HSV円柱モデルの作成
h = np.linspace(0, 1, 90)  # 色相 (Hue)
s = np.linspace(0, 1, 30)  # 彩度 (Saturation)
v = np.linspace(0, 1, 30)  # 明度 (Value)

H, S, V = np.meshgrid(h, s, v, indexing='ij')

# HSV色空間をRGBに変換
HSV = np.stack((H, S, V), axis=-1)
RGB = hsv_to_rgb(HSV)

# 極座標変換
X = S * np.cos(H * 2 * np.pi)
Y = S * np.sin(H * 2 * np.pi)
Z = V

# プロット設定
fig = plt.figure(figsize=(10, 10))
ax = fig.add_subplot(111, projection='3d')

# カラーマップの作成
colors = RGB.reshape(-1, 3)
ax.scatter(X.flatten(), Y.flatten(), Z.flatten(), facecolors=colors, marker='.', s=1)

ax.set_xlabel('Saturation (cos(Hue))')
ax.set_ylabel('Saturation (sin(Hue))')
ax.set_zlabel('Value')
ax.set_title('HSV Color Cylinder')

plt.show()
import numpy as np
import matplotlib.pyplot as plt
import matplotlib.colors as mcolors

def plot_hs_circle():
    size = 300  # 画像のサイズ
    radius = size // 2

    # 円形マスクを作成
    y, x = np.ogrid[-radius:radius, -radius:radius]
    mask = x**2 + y**2 <= radius**2

    # 色相と彩度を計算
    theta = np.arctan2(y, x)
    theta[theta < 0] += 2 * np.pi  # 0から2πの範囲に変換
    r = np.sqrt(x**2 + y**2) / radius

    # HSVからRGBに変換
    h = theta / (2 * np.pi)
    s = r
    v = np.ones_like(h)
    hsv = np.dstack((h, s, v))
    rgb = mcolors.hsv_to_rgb(hsv)

    # 円形領域のみ色を適用
    circle_rgb = np.zeros((size, size, 3))
    circle_rgb[radius-mask.shape[0]//2:radius+mask.shape[0]//2, radius-mask.shape[1]//2:radius+mask.shape[1]//2][mask] = rgb[mask]

    # 画像を表示
    plt.imshow(circle_rgb, extent=[-1, 1, -1, 1])
    plt.axis('off')  # 軸を非表示にする
    plt.show()

plot_hs_circle()
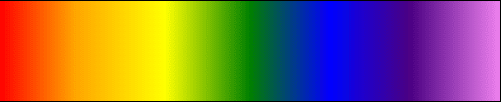
スペクトル
<!DOCTYPE html>
<html lang="en">
<head>
    <meta charset="UTF-8">
    <meta name="viewport" content="width=device-width, initial-scale=1.0">
    <title>Spectral Gradient on Canvas</title>
    <style>
        canvas {
            border: 1px solid black;
            display: block;
            margin: 50px auto;
        }
    </style>
</head>
<body>

<canvas id="myCanvas" width="500" height="100"></canvas>

<script>
    const canvas = document.getElementById("myCanvas");
    const ctx = canvas.getContext("2d");

    // Create a linear gradient
    const gradient = ctx.createLinearGradient(0, 0, canvas.width, 0);
    gradient.addColorStop(0, "red");
    gradient.addColorStop(0.15, "orange");
    gradient.addColorStop(0.33, "yellow");
    gradient.addColorStop(0.5, "green");
    gradient.addColorStop(0.66, "blue");
    gradient.addColorStop(0.82, "indigo");
    gradient.addColorStop(1, "violet");

    // Fill the rectangle with the gradient
    ctx.fillStyle = gradient;
    ctx.fillRect(0, 0, canvas.width, canvas.height);
</script>

</body>
</html>
この記事が気に入ったらサポートをしてみませんか?