
GoogleタイムラインをPythonで読む!

概要
Googleタイムラインの情報をエクスポートしてpythonで集計します。エクスポートした情報には、時間ごとの緯度経度、訪問地の名称などが含まれています。
これらの情報はjsonファイルになっていて、構造がやや複雑です。
下記の有志の書いたリファレンスを参考に、jsonファイルをテーブル形式に変換する処理を書きました。

準備
タイムラインのエクスポート方法
エクスポート方法に関しては、下記のサイトが参考になります。
得られる情報について
以下の時系列情報を得ることができます。
Semantic Location History
activity:移動手段
{waypoint|transit}Path:移動経路の緯度経度
placeVisit:訪問地の緯度経度・住所・名称
Records.json
経路、訪問地の緯度経度
ライブラリのインポートとパスの指定
各種ライブラリをimportします。
また、「ロケーション履歴」フォルダの場所を指定します。
import pandas as pd
import numpy as np
import datetime
import json
from pathlib import Path

import plotly.graph_objects as go
import plotly.express as px

from pprint import pprint

location_history_path = Path("Takeout/ロケーション履歴")
Semantic Location History
フォルダが年毎、ファイルが月ごとに存在しているので、1つのファイルを読み込む関数とそれをすべてのファイルに対して実行する関数を定義します。
def get_semantic_location_history(history_path):
    """
    Semantic Location Historyのjsonを読み込んで、以下二つのデータフレームを変えす
    ・経路・移動手段のデータフレーム
    ・訪問地のデータフレーム
    """
    with open(history_path,encoding='utf-8') as f:
        history = json.load(f)

    # 移動手段、経路地点、訪問地の情報をリストに格納していく ####################
    activity_list = [] # 移動手段
    waypoints_list = [] # 経路地点
    place_list = [] # 訪問地

    for tlobj in history["timelineObjects"]:
        if("activitySegment" in tlobj.keys()):
            actseg = tlobj["activitySegment"]

            row = [
                actseg.get("activityType"),
                actseg.get("distance"),
                actseg.get("duration").get("startTimestamp"),
                actseg.get("duration").get("endTimestamp"),
                actseg.get("startLocation").get("latitudeE7")/10**7,
                actseg.get("startLocation").get("longitudeE7")/10**7,
                actseg.get("endLocation").get("latitudeE7")/10**7,
                actseg.get("endLocation").get("longitudeE7")/10**7,
            ]
            activity_list.append(row)

            if("waypointPath" in actseg.keys()):
                waypath_df = pd.DataFrame(actseg.get("waypointPath").get("waypoints"))/10**7
                waypath_df["startTimestamp"] = actseg.get("duration").get("startTimestamp")
                waypath_df = waypath_df.rename(columns={"latE7":"latitude","lngE7":"longitude"})
                waypoints_list.append(waypath_df)

            if("transitPath" in actseg.keys()):
                waypath_df = pd.DataFrame(actseg.get("transitPath").get("transitStops"))
                waypath_df[["latitude","longitude"]] = waypath_df[["latitudeE7","longitudeE7"]]/10**7
                waypath_df.drop(["latitudeE7","longitudeE7"],axis=1,inplace=True)
                waypath_df["startTimestamp"] = actseg.get("duration").get("startTimestamp")
                waypoints_list.append(waypath_df)
        else:
            plcvst = tlobj["placeVisit"]

            plc_dict = {**plcvst["duration"],**plcvst["location"]}
            plc_dict["placeVisitImportance"] = plcvst["placeVisitImportance"]
            place_list.append(plc_dict)

    # リストをデータフレームに変換 ################
    # activity
    act_cols = [
        "activityType","distance","startTimestamp","endTimestamp",
        "startLatitude","startLongitude","endLatitude","endLongitude"]
    activity_segment = pd.DataFrame(activity_list,columns=act_cols)
    activity_segment["startTimestamp"]=pd.to_datetime(activity_segment["startTimestamp"])+datetime.timedelta(hours=9)
    activity_segment["endTimestamp"]=pd.to_datetime(activity_segment["endTimestamp"])+datetime.timedelta(hours=9)

    # waypoints
    waypoints = pd.concat(waypoints_list)
    waypoints["startTimestamp"] = pd.to_datetime(waypoints["startTimestamp"])+datetime.timedelta(hours=9)

    # activityとwaypointsの情報をマージ
    activity_waypoints = pd.merge(activity_segment,waypoints,on='startTimestamp',how='right')
    activity_waypoints["date"] = activity_waypoints["startTimestamp"].dt.date.astype(str)

    # place_visit
    place_visit = pd.DataFrame.from_dict(place_list)
    place_visit["latitude"] = place_visit["latitudeE7"]/10**7
    place_visit["longitude"] = place_visit["longitudeE7"]/10**7
    place_visit.drop(["latitudeE7","longitudeE7"],axis=1,inplace=True)
    place_visit["startTimestamp"]=pd.to_datetime(place_visit["startTimestamp"])+datetime.timedelta(hours=9)
    place_visit["endTimestamp"]=pd.to_datetime(place_visit["endTimestamp"])+datetime.timedelta(hours=9)

    return activity_waypoints,place_visit
def get_all_semantic_location_history(location_history_path):
# すべてのjsonを読む
history_path_list = list((Path(location_history_path)/"Semantic Location History").glob("*/*.json"))
activity_waypoints_list = []
place_visit_list = []
for path in history_path_list:
activity_waypoints,place_visit=get_semantic_location_history(path)
activity_waypoints_list.append(activity_waypoints)
place_visit_list.append(place_visit)
# データフレームを結合
aw_df = pd.concat(activity_waypoints_list).sort_values("startTimestamp").reset_index(drop=True) # 経路・移動手段
pv_df = pd.concat(place_visit_list).sort_values("startTimestamp").reset_index(drop=True) # 訪問地
return aw_df,pv_df定義した関数を実行します。
aw_df,pv_df = get_all_semantic_location_history(location_history_path)aw_df:移動手段と移動経路の緯度経度
pv_df:訪問地の緯度経度・住所・名称

次に、場所ごとの訪問回数などを集計してみます。
pv_df_agg = pv_df.groupby("placeId")[["startTimestamp","endTimestamp","latitude","longitude","address","name"]].max()
pv_df_agg["last_visit"] = pv_df_agg["endTimestamp"].dt.date
pv_df_agg["last_visit_year"] = pv_df_agg["endTimestamp"].dt.year.astype(str)#+"年"
pv_df_agg["visit_count"] = pv_df.groupby("placeId").size()
pv_df_agg = pv_df_agg.sort_values("endTimestamp")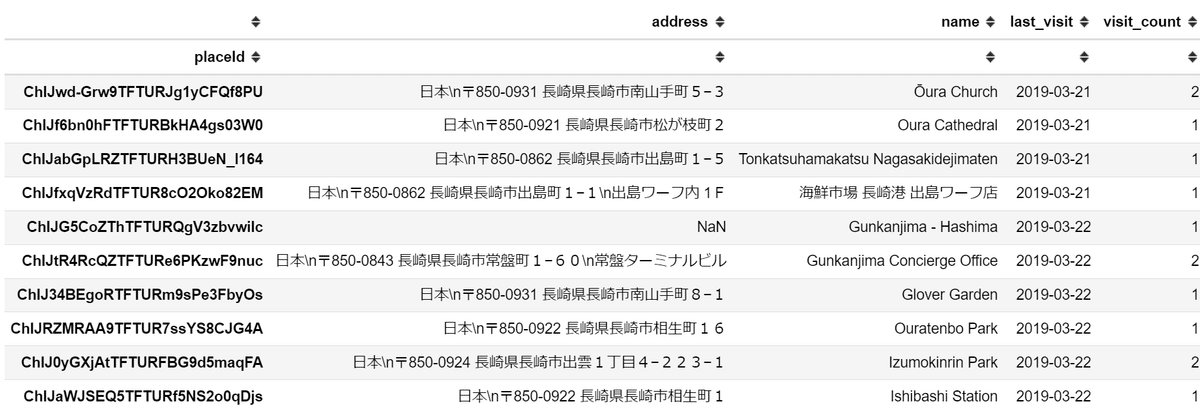
Records.json
これに関しては、json.loadで読み込んでDataFrameに変換するだけで、簡単にテーブル形式になります。
def get_records(location_history_path):
    with open(Path(location_history_path)/"Records.json") as f:
        records = json.load(f)

    records_df = pd.DataFrame(records["locations"])
    records_df["timestamp"] = pd.to_datetime(records_df["timestamp"])
    records_df["latitude"] = records_df["latitudeE7"]/(10**7)
    records_df["longitude"] = records_df["longitudeE7"]/(10**7)
    records_df.drop(["latitudeE7","longitudeE7"],axis=1,inplace=True)
    records_df["source_"] = records_df["source"].fillna("MOVING")
    return records_df
records_df = get_records(location_history_path)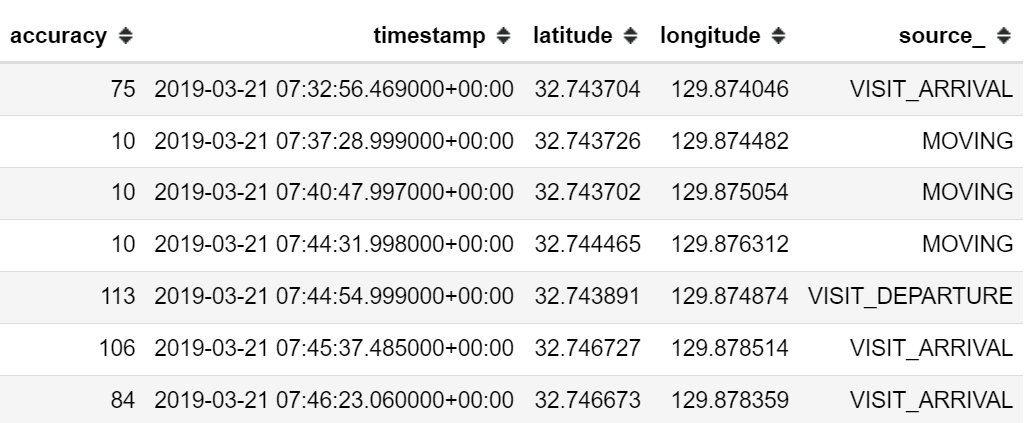
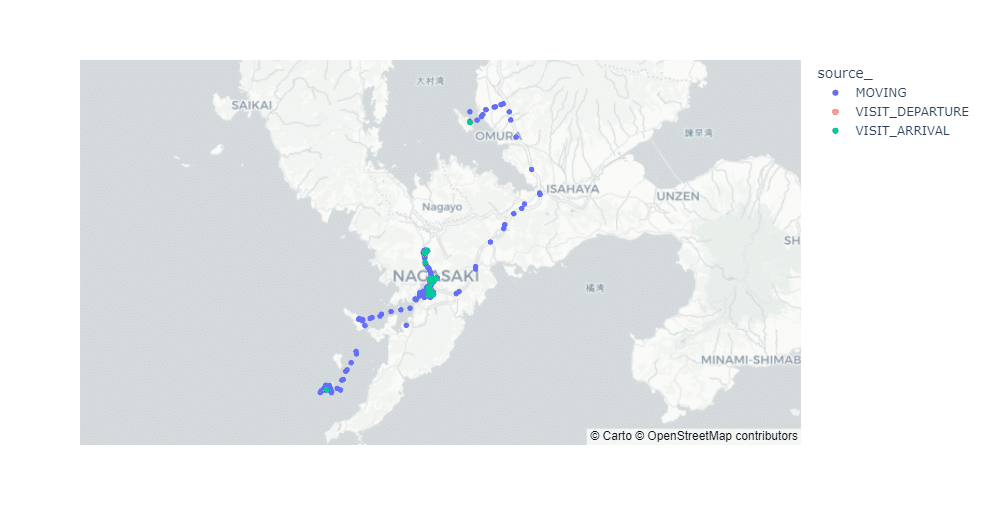
plotlyによる可視化例
px.scatter_mapbox(records_df,
                  lat="latitude",lon='longitude',mapbox_style='carto-positron',color="source_")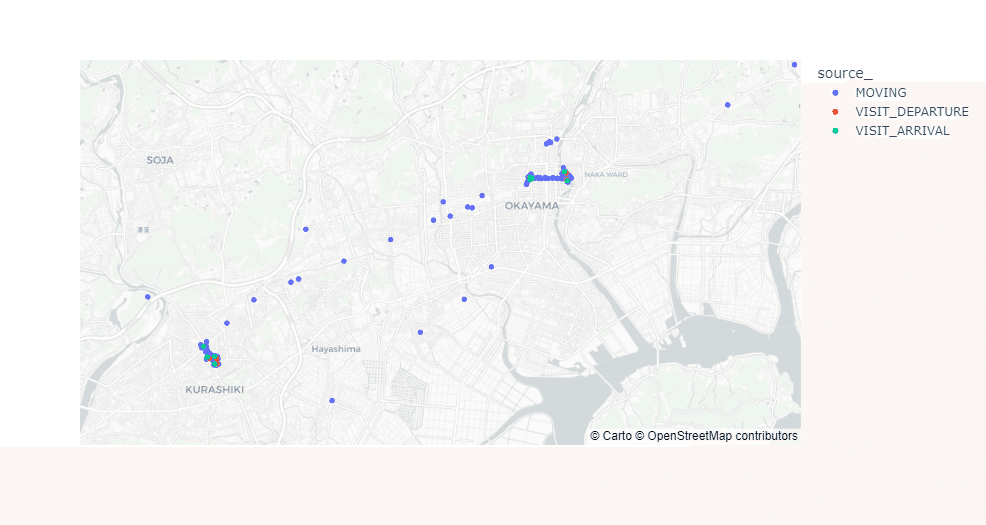
この記事が気に入ったらサポートをしてみませんか?