Matplotlibによるグラフ作成

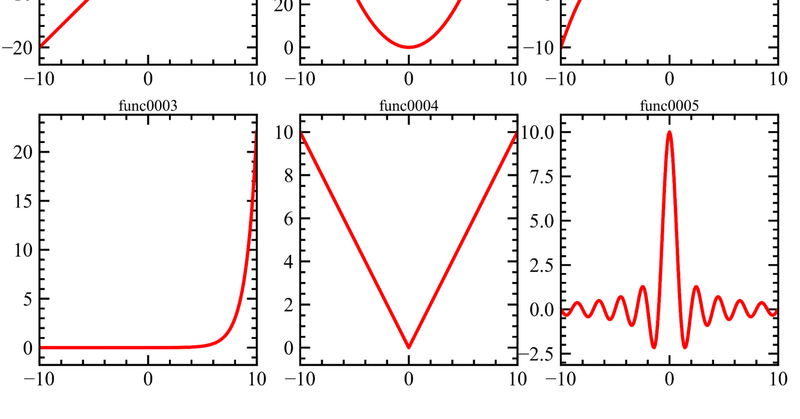
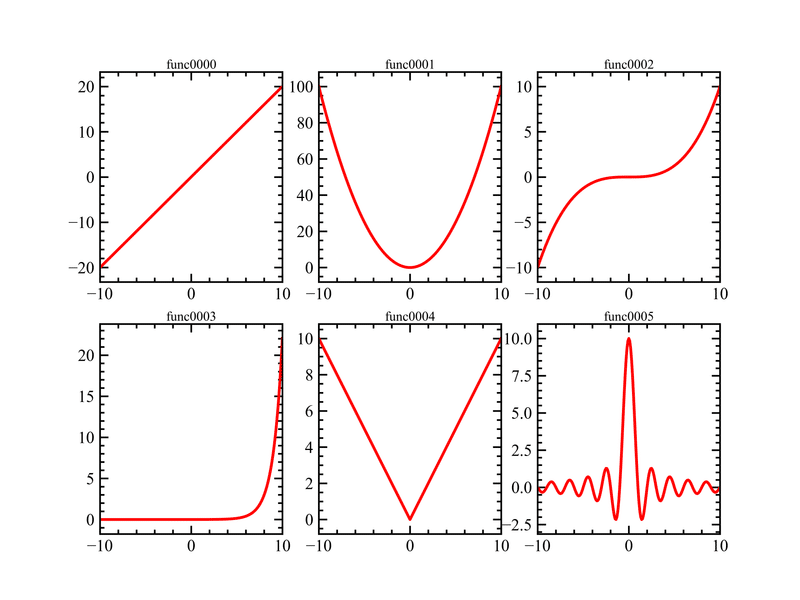
matplotlibを使ったグラフ表示の例です。以下の6つの基本的な関数を表示します。ここでは、オブジェクト指向に基づく記述を採用しています。
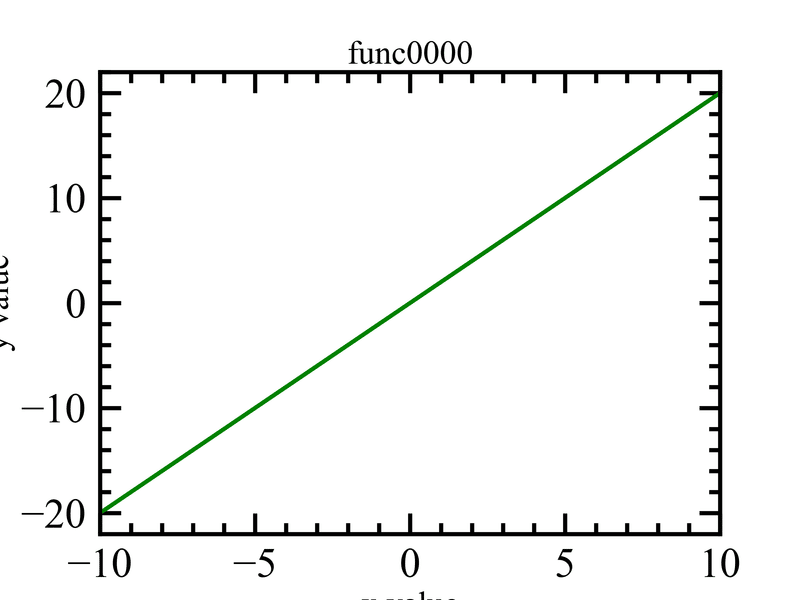
一次関数
二次関数
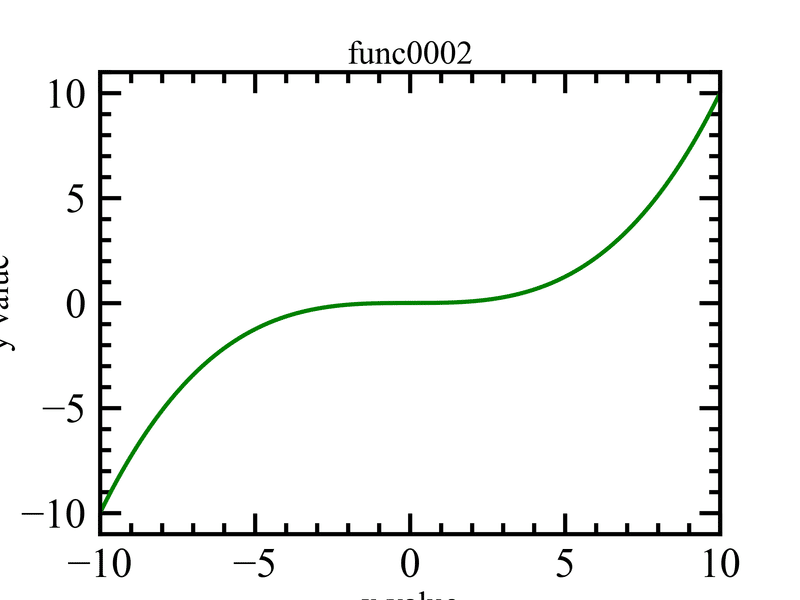
三次関数
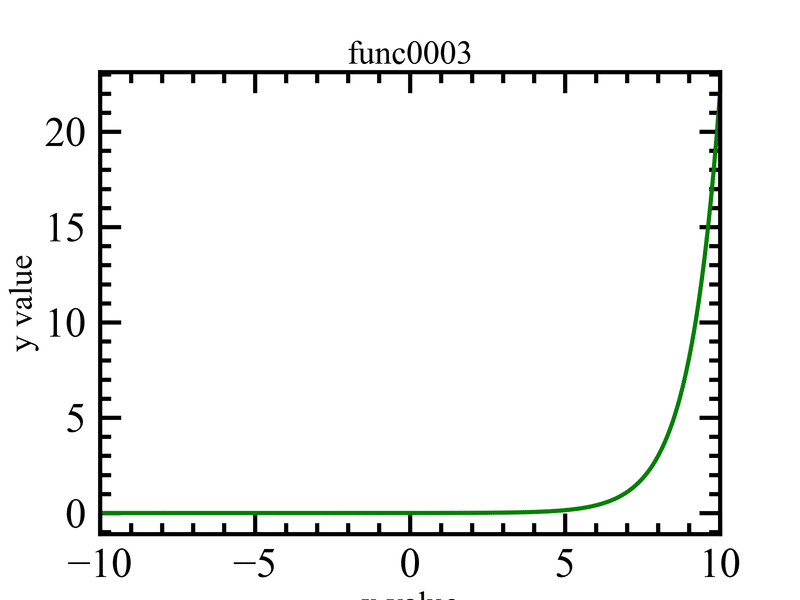
指数関数
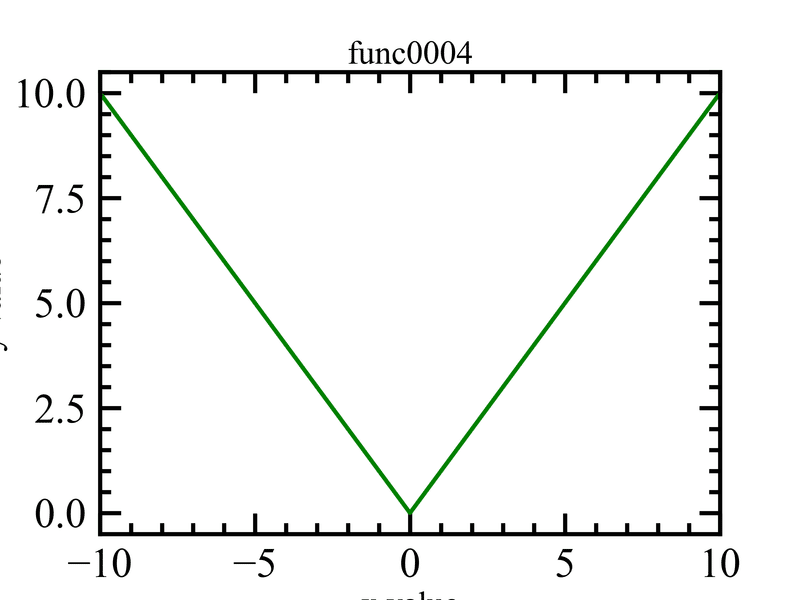
絶対値関数
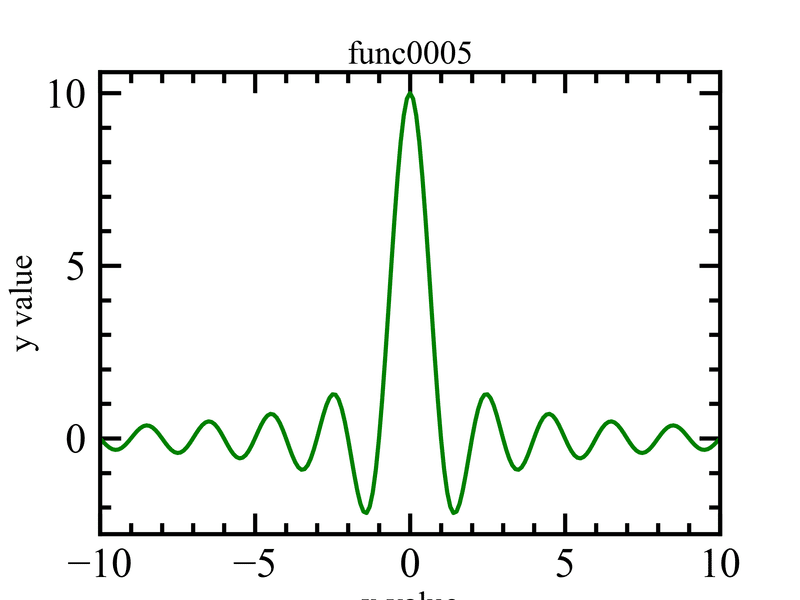
Sinc関数
ダウンロードファイル
コード
メイン(graphing_basic_functions.py)
# -*- coding: utf-8 -*-

from matplotlib import pyplot as plt
import numpy as np
plt.style.use('graphdesign.mplstyle')

N=6
N_x = 201

x = np.linspace(-10, 10, N_x)
f = np.zeros((N, N_x))

#Display following 6 functions
f[0] = x*2
f[1] = x**2
f[2] = x**3/100
f[3] = np.exp(x)/1000
f[4] = np.abs(x)
f[5] = np.sinc(x) * 10

#Separated graphs
fig, ax = plt.subplots()
for i in range(N):
    ax.plot(x, f[i], linewidth=3, color='g')
    ax.set_title("func{0:0>4}".format(i))
    ax.set_xlabel('x value')
    ax.set_ylabel('y value')
    ax.set_xlim(-10, 10)
    fig.savefig("plot{0:0>4}.png".format(i))
    ax.cla()

#One sheet
m=2
n=3
plt.rcParams['figure.figsize'] = 20, 15
fig2, ax2 = plt.subplots(m, n)

for i in range(N):
    ax2[i//n, i%n].plot(x, f[i], linewidth=5, color='r')
    ax2[i//n, i%n].margins(0.0, 0.08)
    ax2[i//n, i%n].set_title("func{0:0>4}".format(i))
fig2.savefig('func.png')
5行目で、以下のファイルを読み込むことで、グラフの細かい設定を行う。(graphdesign.mplstyle)
xtick.top:           True   # draw ticks on the top side
xtick.bottom:        True    # draw ticks on the bottom side
xtick.labeltop:      False   # draw label on the top
xtick.labelbottom:   True    # draw label on the bottom
ytick.left:          True    # draw ticks on the left side
ytick.right:         True   # draw ticks on the right side
ytick.labelleft:     True    # draw tick labels on the left side
ytick.labelright:    False   # draw tick labels on the right side

xtick.direction : in
ytick.direction : in
xtick.labelsize : 30
ytick.labelsize : 30

xtick.minor.visible : True
ytick.minor.visible : True

xtick.major.pad: 10     # distance to major tick label in points
ytick.major.pad: 10     # distance to major tick label in points
xtick.alignment: center  # alignment of xticks
ytick.alignment: center_baseline  # alignment of yticks

xtick.major.width : 3.0
ytick.major.width : 3.0
xtick.major.size : 15
ytick.major.size : 15

xtick.minor.width : 3.0
ytick.minor.width : 3.0
xtick.minor.size : 8
ytick.minor.size : 8

figure.figsize : 8, 6
savefig.dpi : 300
font.family : Times New Roman
font.size : 30

axes.titlesize : 24
axes.labelsize : 24
axes.linewidth : 3.0
表示結果
この記事が気に入ったらサポートをしてみませんか?