Tableau Conference 2023take away Explore the community! Reccomendation for Cross Border Activities

It's hot in Tokyo in July, which means it's been two months since the Tableau Conference. I have been agonizing since right after my return to Japan in May, trying to somehow put into words the three days that seemed to boil down several years' worth of encounters, impressions, and surprises (it was a very painful two months, I confess). But thanks to the two months I spent facing this lovely chaos, I finally reached my core.
Yes, my joy is always with "crossing the border".
The Shape of the Community Revealed at the Tableau Conference
The #Datafam is wonderful. I don't think there's any Tableau user who would dispute this now. Everyone has a place in the Tableau community that feels like HOME, a place they can return to with a sense of comfort. (For those who don't feel like they have such a place, I strongly recommend participating in various events and interactions on social media. Your HOME is definitely somewhere.) This sense of belonging, as the name #Datafam suggests, brings the comfort of a family.

By participating in the Tableau Conference, I was able to directly experience the size, diversity, enthusiasm, passion, and culture at the core of this family. It's a truly magnificent, unique, powerful, and one-of-a-kind community. Indeed, I am convinced that my beloved Tableau community is the best! It was an experience that made me extremely proud of being part of this community and being able to serve as an Ambassador for the past year.
On the other hand, as I walked around the TC venue, attended sessions, and interacted with Ambassadors and Visionaries from all over the world, I realized that I needed to rethink my understanding of my community.
I thought I knew many facets of the Tableau community because I participated not only in JTUG, the largest user group in Japan, but also in MoM, B2VB, and others. However, I realized how many aspects of Tableau I didn't know, such as DataDev, Server|Cloud, Augmented Analytics. And, I saw firsthand how each of these is supported by passionate Tableau users.
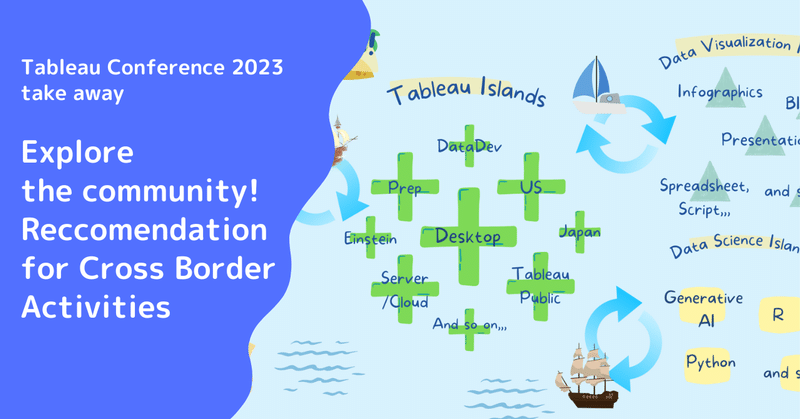
This was a thrilling discovery for me, but also a shocking revelation. Despite being in this beloved community and serving as an Ambassador, I only knew a fraction of the community! From this experience, I have come to envision the community as islands. And the #Datafam is like an island chain made up of these islands. The inhabitants of each island only know about their own island and a very small number of other islands with which they trade, but there are actually many more islands in this island chain, each inhabited by many people.

Set Sail! Let's Explore More 'Islands'!
Since getting this image, I have been engrossed in exploring unknown islands, that is, unfamiliar areas of Tableau and interacting with people from communities in countries other than Japan. The Tableau Conference was full of networking opportunities. Like many participants, networking was the primary goal for those attending the Tableau Conference. Many people welcomed me. While being part of a familiar community, I was brought several fresh surprises, as if opening the door to a new world.
The Tableau Conference ended in just three days, but I couldn't forget that dynamic experience. And while cherishing that wonderful experience, I wondered if it was really okay to just wait for the next TC.
Then, I began to think how wonderful it would be if I could take on a role like a merchant who ventures out to sea, trades with other islands, brings back goods and information, and moves lightly between communities, connecting the islands. This blog is both a declaration of that belief and the first step in that activity.
This blog is released in both Japanese and English. (For the Japanese version, see here.) I would like to continue to share information from Japan in English, and information from English-speaking areas in Japanese. Also, I'd like to share information about DataDev and Server & Cloud to the Desktop island, moving between islands.
And I am a greedy merchant. I want to expand the wonders of this Tableau island chain to other islands and want even bigger trades. I would like to venture even further from the Tableau island chain and take on collaborations with data engineering islands (Cloud Database, Data Warehouse, ETL, etc.), other data visualization islands (Infographics, BI tools, Spreadsheets, etc.), and data science islands (R, Generative AI, Python, etc.).

Settling on an island and invigorating it is important. However, there are also people like me who find crossing borders to be the ultimate joy. And, under the name "We help people see and understand data," Tableau has been increasing its features beyond drag-and-drop data visualization. Our island chain is expanding. Greater diversity, new comrades, and skills are required. Border crossers are the frontrunners in advancing this. (Super cool!)
What Merchant Rika is Doing Now
Trade 1: Within the Tableau Islands
My HOME can be said to be Japan Island, Desktop Island, and Tableau Public Island. From there, I want to interact with other islands.
・Writing a Japanese-English blog: This is the first step.
・Participation in Coders Initiative user group meetings: For me, areas such as APIs, Embedded Analysis were the territories of other islands, but I'm aiming to acquire knowledge and connections in this field while participating in Coders Initiative events. At the same time, it's a new attempt to participate in user group meetings outside of Japan.
Trade 2: Tableau Islands × Data Engineering Islands
When looking over the entire architecture, we notice that there is always an 'upstream' data source for the Tableau we use. Snowflake, dbt, AWS, GCP, Microsoft Azure... these are the products of Data Warehouse, ETL/ELT, and CloudDB areas. I definitely want to get along with the people of these islands. Because it's hard to cover all aspects of data utilization just with Tableau products. By understanding these upstream products correctly, our Tableau can demonstrate its true value, and by letting data engineers who handle upstream products know about our Tableau, we should be able to increase the value of our organization as a whole.
・Participation & Presentation at SnowVillage: Snowflake, like Tableau, has a wonderful community. As a resident of the Tableau community, I have started participating in the Snowflake community.
Trade 3: Tableau Islands × Data Visualization Islands
We, who have realized the fun and power of data visualization mainly through dashboards, when we look at the entire data visualization, we shouldn't forget that the field of data visualization is wider than we thought, right? Including infographics that enhance static and impactful visual expressions on paper or screen, graph representations of fact data that add persuasiveness to presentations, etc. And the tools are diverse. Spreadsheet software like Excel & Google Spreadsheets, BI tools like Looker, Power BI, scripts like Python, R, applications, software... there are countless. Thanks to Tabelau, we understand well the inherent power of data visualization. By taking an interest in a new 'How' and getting involved, we should definitely become richer.
・Participation in Streamlit (Python-based) study group
・Studying PowerBI
Trade 4: Tableau Islands × Data Science Islands
The main battlefield for us, the creators of dashboards, is the field of descriptive statistics. "That's just a thing of the past," "In the end, what's going to happen?" How many times have we felt frustrated by these words! Incorporating the essence of data science should give us more power.
・Contemplating how to intertwine
Let's travel between islands, trade people and information! A Recommendation to be Merchants
Sadly, there is a language barrier between the Japanese-speaking community and other language communities. This is undeniable. However, Japan has an overflowing passion and uniqueness due to its unique growth. All that's left is to make the effort to convey this. I'm passionate about this being my job.
Also, I really love the Tableau community, the #Datafam . I want more and more people outside of Tableau users to know about this wonderfulness. For that, we need more border crossers who have the pride and identity of #Datafam and advance into other fields. And when the future comes when all kinds of people say, "Those #Datafam guys are amazing," surely, our beloved #datafam will become even more wonderful. This year will definitely be more fun than ever!
If you're interested in acting as a border crosser, please find me on social media and reach out. What we can do alone is limited. Let's form a caravan together!

Twitter @Rika_Olga_F
Tableau Public Profile
https://public.tableau.com/app/profile/rika.fujiwara
この記事が気に入ったらサポートをしてみませんか?