機械学習を用いた優れた投手のセイバーメトリクス探索
対象データ
今回はメジャーリーグでの2010年から2022年の13年間のデータを用いた
import numpy as np
import pandas as pd
import matplotlib.pyplot as plt
import seaborn as sns

from sklearn.model_selection import *
from sklearn.preprocessing import *
from sklearn.linear_model import *
from sklearn.metrics import *

from pybaseball import pitching_stats

import lightgbm as lgb

import optuna
import warnings
warnings.filterwarnings('ignore',category=UserWarning)

pitching_df = pitching_stats(2010, 2022)

# 先発投手だけを抽出(GSが1以上の投手)
starter_pitching_df = pitching_df[pitching_df['GS'] > 0]
starter_pitching_df
目的変数を防御率ERAにして
それを作り出す目的変数に独立な変数を特徴量にもった
# 特徴量として使用するカラムをリストで指定
feature_columns = ['IP'
                   , 'H'
                   , 'HR'
                   , 'BB'
                   , 'SO'
                   , 'WHIP'
                   , 'K/9'
                   , 'BB/9'
                   , 'HR/9'
                   , 'K/BB'
                   , 'LOB%'
                   ,'BABIP'
                   , 'GB%'
                   , 'FB%'
                   , 'LD%'
                   , 'HR/FB']

# データから特徴量を抽出
X = starter_pitching_df[feature_columns]

# 目的変数(ターゲット):防御率(ERA)
y = starter_pitching_df['ERA']
特徴量選択
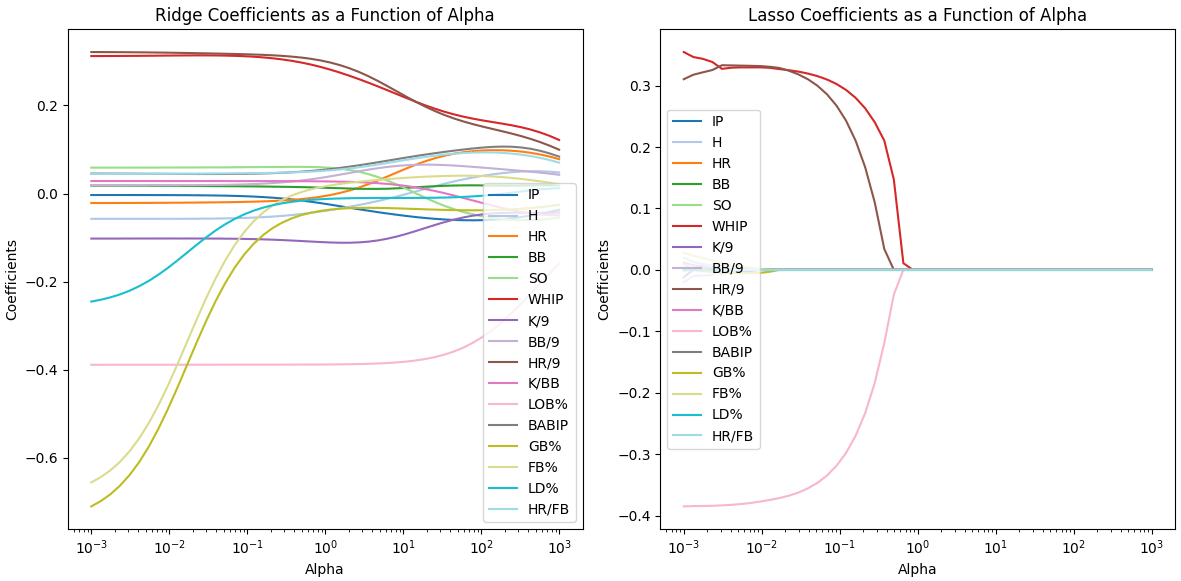
最初はリッジラッソ回帰で特徴量の振る舞いを確認する
# データの前処理
numeric_columns = X.select_dtypes(include = np.number).columns.to_list()
X = pd.get_dummies(X, drop_first=True)
X_train, X_test, y_train, y_test = train_test_split(X, y, test_size=0.3, random_state=42)

# RidgeとLassoのパラメーターの範囲を定義
alphas = np.logspace(-3, 3)

scaler = StandardScaler()
X_train[numeric_columns] = scaler.fit_transform(X_train[numeric_columns])
X_test[numeric_columns] = scaler.transform(X_test[numeric_columns])

# RidgeモデルとLassoモデルを試す
ridge_coefs = []
lasso_coefs = []
ridge_mse_list = []
lasso_mse_list = []

for alpha in alphas:
    # Ridge回帰
    ridge_model = Ridge(alpha=alpha)
    ridge_model.fit(X_train, y_train)
    ridge_y_pred = ridge_model.predict(X_test)
    ridge_mse = mean_squared_error(y_test, ridge_y_pred)
    ridge_mse_list.append(ridge_mse)
    ridge_coefs.append(ridge_model.coef_)

    # Lasso回帰
    lasso_model = Lasso(alpha=alpha)
    lasso_model.fit(X_train, y_train)
    lasso_y_pred = lasso_model.predict(X_test)
    lasso_mse = mean_squared_error(y_test, lasso_y_pred)
    lasso_mse_list.append(lasso_mse)
    lasso_coefs.append(lasso_model.coef_)

# 特徴量ごとに異なる色を設定
colors = plt.cm.get_cmap('tab20', len(numeric_columns))

# RidgeとLassoの結果をプロット

plt.figure(figsize=(12, 6))

# Ridgeのプロット
plt.subplot(1, 2, 1)
for i in range(len(numeric_columns)):
    plt.plot(alphas, [coef[i] for coef in ridge_coefs], label=numeric_columns[i], color=colors(i))
plt.xscale('log')
plt.xlabel('Alpha')
plt.ylabel('Coefficients')
plt.title('Ridge Coefficients as a Function of Alpha')
plt.legend(loc='best')

# Lassoのプロット
plt.subplot(1, 2, 2)
for i in range(len(numeric_columns)):
    plt.plot(alphas, [coef[i] for coef in lasso_coefs], label=numeric_columns[i], color=colors(i))
plt.xscale('log')
plt.xlabel('Alpha')
plt.ylabel('Coefficients')
plt.title('Lasso Coefficients as a Function of Alpha')
plt.legend(loc='best')

plt.tight_layout()
plt.show()

# MSEの比較
plt.figure(figsize=(8, 6))
plt.plot(alphas, ridge_mse_list, label='Ridge MSE', color='blue', linewidth=2)
plt.plot(alphas, lasso_mse_list, label='Lasso MSE', color='orange', linewidth=2)
plt.xscale('log')
plt.xlabel('Alpha')
plt.ylabel('Mean Squared Error')
plt.title('Ridge vs Lasso MSE')
plt.legend(loc='best')
plt.show()
ラッソ回帰を見てみると3つの特徴量
'WHIP’ (投球回あたりの許した四球と安打の合計)
'HR/9' (9回あたりの被本塁打率)
'LOB%' (投手が許したランナーのうち、得点せずに残塁した割合)
以外は0に収束している

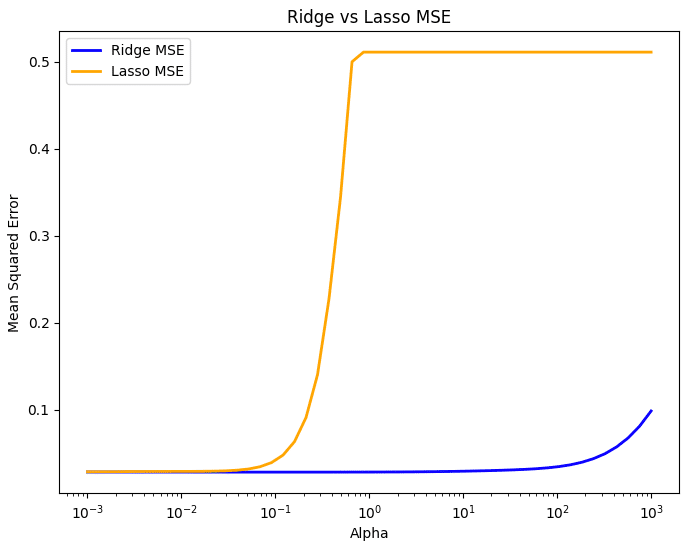
またリッジとラッソを比較すると
パラメーターが0.01付近だとMSEが小さいままであるが
3つの特徴量がラッソ回帰で失われた瞬間から精度が悪化する

従ってこの3つの特徴量がERA予測に必要だと考えられるので
'WHIP’ (投球回あたりの許した四球と安打の合計)
'HR/9' (9回あたりの被本塁打率)
'LOB%' (投手が許したランナーのうち、得点せずに残塁した割合)
を用いて頑健な説明性のある回帰モデルを以下
lightgbmで作成する
モデル作成
lightgbmように検証用データを新たに作る
# データセットを訓練用、バリデーション用、テスト用に分割
X_train_full, X_test, y_train_full, y_test = train_test_split(X, y, test_size=0.2, random_state=42)
X_train, X_val, y_train, y_val = train_test_split(X_train_full, y_train_full, test_size=0.25, random_state=42)
ハイパーパラメーター最適化をoptuneで行う
param_base = {
    'objective':'regression'
    , 'random_seed':42
    , 'learning_rate':0.02
    , 'min_data_in_bin':3
    , 'bagging_freq':1
    , 'bagging_seed':0
    , 'verbose':-1
}
def objective(trial):
params_tuning = {
'num_leaves': trial.suggest_int('num_leaves', 2, 256),
'min_data_in_leaf': trial.suggest_int('min_data_in_leaf', 2, 30),
'max_bin': trial.suggest_int('max_bin', 200, 400),
'bagging_fraction': trial.suggest_float('bagging_fraction', 0.8, 0.95),
'feature_fraction': trial.suggest_float('feature_fraction', 0.35, 0.65),
'min_gain_to_split': trial.suggest_float('min_gain_to_split', 0.01, 1, log=True),
'lambda_l1': trial.suggest_float('lambda_l1', 0.01, 1, log=True),
'lambda_l2': trial.suggest_float('lambda_l2', 0.01, 1, log=True)
}
params_tuning.update(param_base)
# LightGBM用のデータセットを作成
lgb_train = lgb.Dataset(X_train, y_train)
lgb_eval = lgb.Dataset(X_val, y_val)
# LightGBMモデルを学習
model = lgb.train(
params_tuning,
lgb_train,
num_boost_round=10000,
valid_sets=[lgb_train, lgb_eval],
valid_names=['train', 'valid'],
callbacks=[lgb.early_stopping(100), lgb.log_evaluation(500)]
)
# 検証データに対する予測
y_val_pred = model.predict(X_val, num_iteration=model.best_iteration)
# MSE(平均二乗誤差)を計算
score = mean_squared_error(y_val, y_val_pred)
return scorestudy = optuna.create_study(
sampler=optuna.samplers.TPESampler(seed=42)
, direction='minimize')
study.optimize(objective, n_trials=200)ハイパーパラメーター最適化の後に
実際のモデルで予測値作成
# LightGBM用のデータセットを作成
lgb_train = lgb.Dataset(X_train, y_train)
lgb_eval = lgb.Dataset(X_val, y_val)
# 最適なパラメータでLightGBMモデルを学習
model = lgb.train(
param_best,
lgb_train,
num_boost_round=10000,
valid_sets=[lgb_train, lgb_eval],
valid_names=['train', 'valid'],
callbacks=[lgb.early_stopping(100), lgb.log_evaluation(500)]
)
# 特徴量重要度の取得
importance = model.feature_importance(importance_type='split')
feature_names = X_train.columns
# 特徴量重要度のプロット
plt.figure(figsize=(10, 6))
plt.barh(feature_names, importance, align='center')
plt.xlabel("Feature Importance (split)")
plt.title("LightGBM Feature Importance")
plt.show()
# テストデータで予測してMSEを計算
y_pred = model.predict(X_test, num_iteration=model.best_iteration)
mse = mean_squared_error(y_test, y_pred)
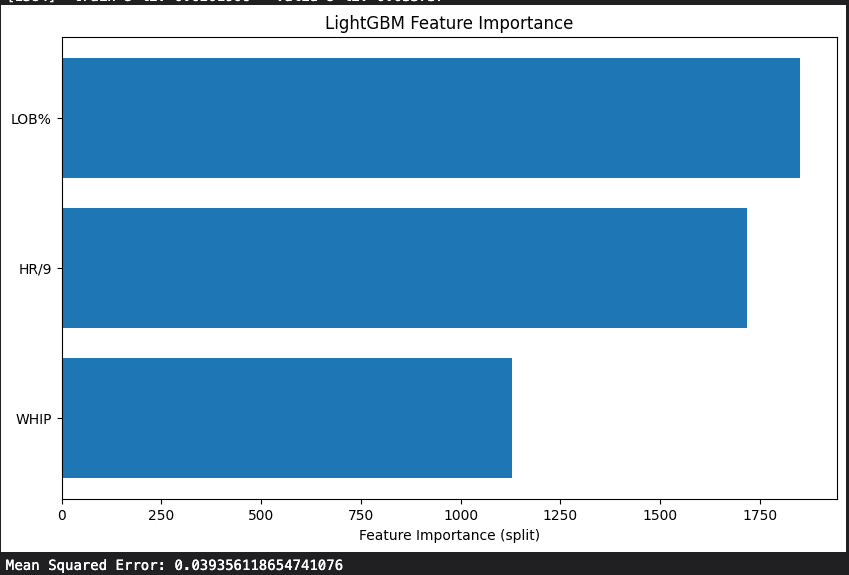
print(f"Mean Squared Error: {mse}")特徴量重要度では
LOB%
HR/9
WHIP
の順番にERA(防御率)を予測できるという結果が出た

ERAとは単純に投手の成績が最も反映されているものだが
これを予測しうる主な構成要素は
LOB%
HR/9
WHIP
となるので上記の指標が優れている選手を発掘するのがいいと考えられる
以下全文コード
import numpy as np
import pandas as pd
import matplotlib.pyplot as plt
import seaborn as sns
from sklearn.model_selection import *
from sklearn.preprocessing import *
from sklearn.linear_model import *
from sklearn.metrics import *
from pybaseball import pitching_stats
import lightgbm as lgb
import optuna
import warnings
warnings.filterwarnings('ignore',category=UserWarning)
pitching_df = pitching_stats(2010, 2022)
# 先発投手だけを抽出(GSが1以上の投手)
starter_pitching_df = pitching_df[pitching_df['GS'] > 0]
# 特徴量として使用するカラムをリストで指定
feature_columns = ['IP'
, 'H'
, 'HR'
, 'BB'
, 'SO'
, 'WHIP'
, 'K/9'
, 'BB/9'
, 'HR/9'
, 'K/BB'
, 'LOB%'
,'BABIP'
, 'GB%'
, 'FB%'
, 'LD%'
, 'HR/FB']
# データから特徴量を抽出
X = starter_pitching_df[feature_columns]
# 目的変数(ターゲット):防御率(ERA)
y = starter_pitching_df['ERA']
# データの前処理
numeric_columns = X.select_dtypes(include = np.number).columns.to_list()
X = pd.get_dummies(X, drop_first=True)
X_train, X_test, y_train, y_test = train_test_split(X, y, test_size=0.3, random_state=42)
# RidgeとLassoのパラメーターの範囲を定義
alphas = np.logspace(-3, 3)
scaler = StandardScaler()
X_train[numeric_columns] = scaler.fit_transform(X_train[numeric_columns])
X_test[numeric_columns] = scaler.transform(X_test[numeric_columns])
# RidgeモデルとLassoモデルを試す
ridge_coefs = []
lasso_coefs = []
ridge_mse_list = []
lasso_mse_list = []
for alpha in alphas:
# Ridge回帰
ridge_model = Ridge(alpha=alpha)
ridge_model.fit(X_train, y_train)
ridge_y_pred = ridge_model.predict(X_test)
ridge_mse = mean_squared_error(y_test, ridge_y_pred)
ridge_mse_list.append(ridge_mse)
ridge_coefs.append(ridge_model.coef_)
# Lasso回帰
lasso_model = Lasso(alpha=alpha)
lasso_model.fit(X_train, y_train)
lasso_y_pred = lasso_model.predict(X_test)
lasso_mse = mean_squared_error(y_test, lasso_y_pred)
lasso_mse_list.append(lasso_mse)
lasso_coefs.append(lasso_model.coef_)
# 特徴量ごとに異なる色を設定
colors = plt.cm.get_cmap('tab20', len(numeric_columns))
# RidgeとLassoの結果をプロット
plt.figure(figsize=(12, 6))
# Ridgeのプロット
plt.subplot(1, 2, 1)
for i in range(len(numeric_columns)):
plt.plot(alphas, [coef[i] for coef in ridge_coefs], label=numeric_columns[i], color=colors(i))
plt.xscale('log')
plt.xlabel('Alpha')
plt.ylabel('Coefficients')
plt.title('Ridge Coefficients as a Function of Alpha')
plt.legend(loc='best')
# Lassoのプロット
plt.subplot(1, 2, 2)
for i in range(len(numeric_columns)):
plt.plot(alphas, [coef[i] for coef in lasso_coefs], label=numeric_columns[i], color=colors(i))
plt.xscale('log')
plt.xlabel('Alpha')
plt.ylabel('Coefficients')
plt.title('Lasso Coefficients as a Function of Alpha')
plt.legend(loc='best')
plt.tight_layout()
plt.show()
# MSEの比較
plt.figure(figsize=(8, 6))
plt.plot(alphas, ridge_mse_list, label='Ridge MSE', color='blue', linewidth=2)
plt.plot(alphas, lasso_mse_list, label='Lasso MSE', color='orange', linewidth=2)
plt.xscale('log')
plt.xlabel('Alpha')
plt.ylabel('Mean Squared Error')
plt.title('Ridge vs Lasso MSE')
plt.legend(loc='best')
plt.show()
# Lassoの結果から特徴量として使用するカラムをリストで指定
trg_columns = ['WHIP'
, 'HR/9'
, 'LOB%']
# データから特徴量を抽出
X = starter_pitching_df[trg_columns]
# 目的変数(ターゲット):防御率(ERA)
y = starter_pitching_df['ERA']
# データの前処理
numeric_columns = X.select_dtypes(include = np.number).columns.to_list()
X = pd.get_dummies(X, drop_first=True)
X_train, X_test, y_train, y_test = train_test_split(X, y, test_size=0.3, random_state=42)
# RidgeとLassoのパラメーターの範囲を定義
alphas = np.logspace(-3, 3)
scaler = StandardScaler()
X_train[numeric_columns] = scaler.fit_transform(X_train[numeric_columns])
X_test[numeric_columns] = scaler.transform(X_test[numeric_columns])
# Lassoモデルを試す
lasso_coefs_2 = []
lasso_mse_list_2 = []
for alpha in alphas:
# Lasso回帰
lasso_model = Lasso(alpha=alpha)
lasso_model.fit(X_train, y_train)
lasso_y_pred = lasso_model.predict(X_test)
lasso_mse = mean_squared_error(y_test, lasso_y_pred)
lasso_mse_list_2.append(lasso_mse)
lasso_coefs_2.append(lasso_model.coef_)
# 特徴量ごとに異なる色を設定
colors = plt.cm.get_cmap('tab20', len(numeric_columns))
# RidgeとLassoの結果をプロット
plt.figure(figsize=(12, 6))
for i in range(len(numeric_columns)):
plt.plot(alphas, [coef[i] for coef in lasso_coefs_2], label=numeric_columns[i], color=colors(i))
plt.xscale('log')
plt.xlabel('Alpha')
plt.ylabel('Coefficients')
plt.title('Lasso Coefficients as a Function of Alpha')
plt.legend(loc='best')
plt.show()
# MSEの比較
plt.figure(figsize=(8, 6))
plt.plot(alphas, lasso_mse_list, label='full columns Lasso MSE', color='blue', linewidth=2)
plt.plot(alphas, lasso_mse_list_2, label='trg columns Lasso MSE', color='orange', linewidth=2)
plt.xscale('log')
plt.xlabel('Alpha')
plt.ylabel('Mean Squared Error')
plt.title('Ridge vs Lasso MSE')
plt.legend(loc='best')
plt.show()
print(f'{np.min(lasso_mse_list)}')
print(f'{np.min(lasso_mse_list_2)}')
# データセットを訓練用、バリデーション用、テスト用に分割
X_train_full, X_test, y_train_full, y_test = train_test_split(X, y, test_size=0.2, random_state=42)
X_train, X_val, y_train, y_val = train_test_split(X_train_full, y_train_full, test_size=0.25, random_state=42)
param_base = {
'objective':'regression'
, 'random_seed':42
, 'learning_rate':0.02
, 'min_data_in_bin':3
, 'bagging_freq':1
, 'bagging_seed':0
, 'verbose':-1
}
def objective(trial):
    params_tuning = {
        'num_leaves': trial.suggest_int('num_leaves', 2, 256),
        'min_data_in_leaf': trial.suggest_int('min_data_in_leaf', 2, 30),
        'max_bin': trial.suggest_int('max_bin', 200, 400),
        'bagging_fraction': trial.suggest_float('bagging_fraction', 0.8, 0.95),
        'feature_fraction': trial.suggest_float('feature_fraction', 0.35, 0.65),
        'min_gain_to_split': trial.suggest_float('min_gain_to_split', 0.01, 1, log=True),
        'lambda_l1': trial.suggest_float('lambda_l1', 0.01, 1, log=True),
        'lambda_l2': trial.suggest_float('lambda_l2', 0.01, 1, log=True)
    }

    params_tuning.update(param_base)

    # LightGBM用のデータセットを作成
    lgb_train = lgb.Dataset(X_train, y_train)
    lgb_eval = lgb.Dataset(X_val, y_val)

    # LightGBMモデルを学習
    model = lgb.train(
        params_tuning,
        lgb_train,
        num_boost_round=10000,
        valid_sets=[lgb_train, lgb_eval],
        valid_names=['train', 'valid'],
        callbacks=[lgb.early_stopping(100), lgb.log_evaluation(500)]
    )

    # 検証データに対する予測
    y_val_pred = model.predict(X_val, num_iteration=model.best_iteration)

    # MSE(平均二乗誤差)を計算
    score = mean_squared_error(y_val, y_val_pred)

    return score
trial = study.best_trial
print(f'trial: {trial.number}')
print(f'score: {trial.value:.2f}')
param_best = trial.params
param_best.update(param_base)
display(param_best)
optuna.visualization.plot_param_importances(study).show()
# LightGBM用のデータセットを作成
lgb_train = lgb.Dataset(X_train, y_train)
lgb_eval = lgb.Dataset(X_val, y_val)

# 最適なパラメータでLightGBMモデルを学習
model = lgb.train(
    param_best,
    lgb_train,
    num_boost_round=10000,
    valid_sets=[lgb_train, lgb_eval],
    valid_names=['train', 'valid'],
    callbacks=[lgb.early_stopping(100), lgb.log_evaluation(500)]
)

# 特徴量重要度の取得
importance = model.feature_importance(importance_type='split')
feature_names = X_train.columns

# 特徴量重要度のプロット
plt.figure(figsize=(10, 6))
plt.barh(feature_names, importance, align='center')
plt.xlabel("Feature Importance (split)")
plt.title("LightGBM Feature Importance")
plt.show()

# テストデータで予測してMSEを計算
y_pred = model.predict(X_test, num_iteration=model.best_iteration)
mse = mean_squared_error(y_test, y_pred)
print(f"Mean Squared Error: {mse}")この記事が気に入ったらサポートをしてみませんか?
