
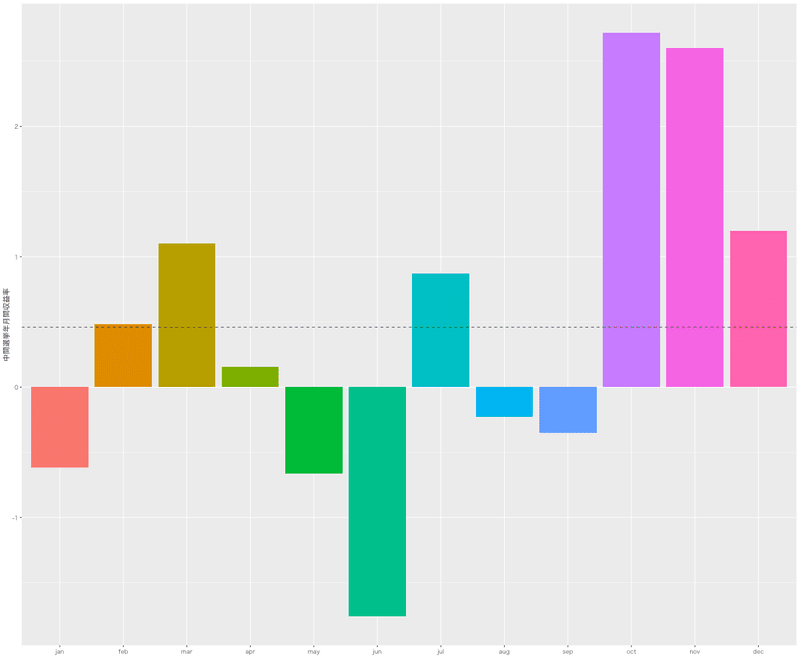
中間選挙年の月間収益率

概要
中間選挙年の月間収益率を出す。
具体的には 1950 1954 1958 1962 1966 1970 1974 1978 1982 1986 1990 1994 1998 2002 2006 2010 2014 2018の各年の月間収益率を平均したものである。
黒字点線で平均年間収益率を示す。
m <- monthlyReturn(GSPC)["::2021"] %>% matrix(.,nrow=12) %>% t()
df <- data.frame(gap=(apply(m[seq(1,72,4),],2,mean)*100),mon=factor(seq(1,12,1)))
p <- ggplot(df, aes(x=mon,y=gap,fill =mon))
p <- p + scale_x_discrete(label=c("jan","feb","mar","apr","may","jun","jul","aug","sep","oct","nov","dec"))  #x  -axis label
p <- p + geom_bar(stat = "identity") # need identity to draw value itself.
p <- p + geom_hline(yintercept=mean((apply(m[seq(1,72,4),],2,mean)*100)),linetype=2,alpha=0.7,size=0.5,color='black')
p <- p + theme_gray (base_family = "HiraKakuPro-W3")
p <- p + xlab("") + ylab("中間選挙年月間収益率")
p <- p + theme(legend.position = 'none')  # erase legend
plot(p)
png("~/Dropbox/R-script/covid/w.png", width = 1200, height = 1000)
plot(p)
dev.off()
サンプル画像
この記事が気に入ったらサポートをしてみませんか?