seaborn で綺麗な混同行列を描きたい

0. とりあえず描いてみる
適当に正解データと予測データを作ります(作り方は最後に)。
true = [0, 0, 0, 0, 0, 0, 1, 1, 1, 1, 2, 2,
        2, 2, 2, 2, 2, 2, 2, 3, 3, 3, 3, 3,
        3, 3, 4, 4, 5, 5, 6, 6, 6, 6, 6, 6, 6]

predict = [0, 0, 0, 0, 0, 0, 0, 0, 1, 2, 3, 0, 4,
           2, 6, 4, 2, 2, 0, 0, 4, 0, 0, 6, 6, 6,
           0, 0, 6, 2, 3, 0, 6, 6, 0, 6, 1]

# numpy 形式に変換
import numpy as np
true = np.array(true)
predict = np.array(predict)
scikit-learn の関数 confusion_matrix を使うと混同行列を作成できます。pandas は表示を見やすくするために使っています。
from sklearn.metrics import confusion_matrix
import pandas as pd
pd.options.display.precision = 4 # 表示桁数の設定

conf_mat = confusion_matrix(true, predict, normalize='true')
display(pd.DataFrame(conf_mat))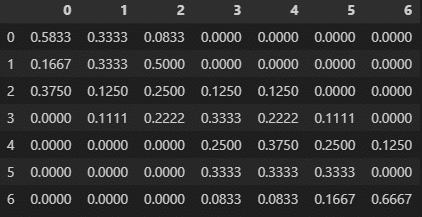
seaborn のヒートマップを使うと混同行列を出力できます。色は Blues が好みです。
import matplotlib.pyplot as plt
plt.rcParams['font.family'] = 'Arial' # フォントを指定
import seaborn as sns

plt.figure(figsize=(6, 5))
sns.heatmap(conf_mat1, cmap = 'Blues', annot=True)
plt.show()
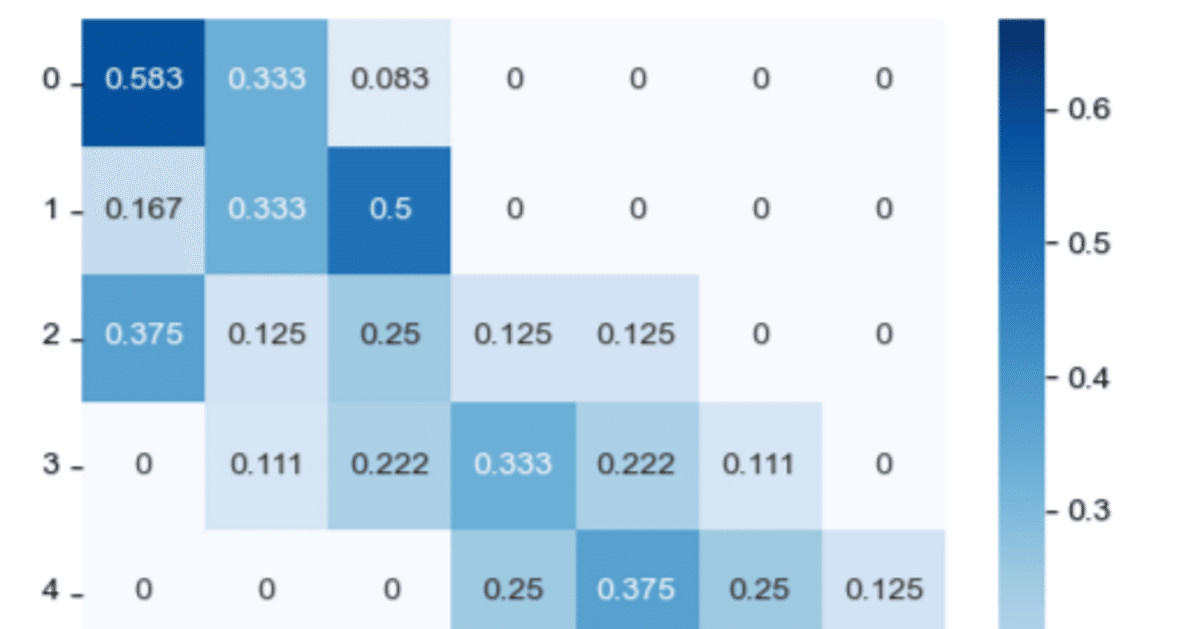
1. ylabel は回転しなくて良いのでは?
一番左の true のクラスを表す ylabel がなぜか回転しています。matplotlib の設定で戻してあげることができます。
plt.figure(figsize=(6, 5))
sns.heatmap(conf_mat, cmap = 'Blues', annot=True)
plt.yticks(rotation=0)
plt.show()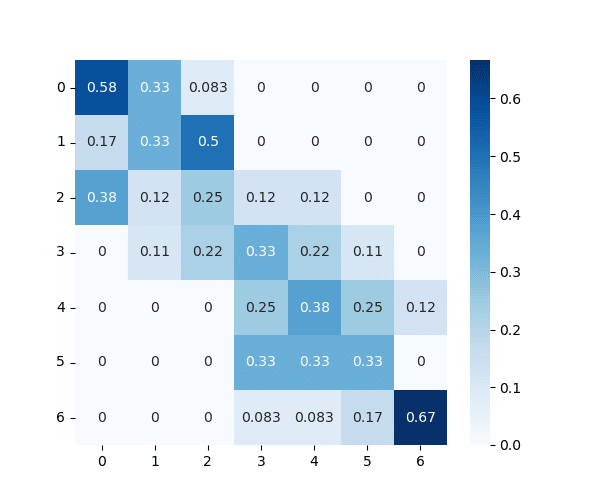
2. 桁数をそろえたい
上の出力を見ると、小数点以下の桁数がそろっていないのが少し気になります(有効数字で揃えられています)。例えば一番上の行を横に足すと 0.993 になります。0.99 や 0.999 なら丸め誤差だろうと理解できるのですが、3 が出てくるとちょっと変な感じがするのは自分だけでしょうか?
手っ取り早い対策として、seaborn の heatmap には fmt という引数があり、これを使うと小数点以下の桁数で揃えられます。
plt.figure(figsize=(6, 5))
sns.heatmap(conf_mat, cmap = 'Blues', annot=True, fmt = '.3f')
plt.yticks(rotation=0)
plt.show()
引数 fmt を使うと桁数は揃いましたが、今度は 0.000 がうるさいです。「基本は小数点以下 3 桁で記載するが、わざわざ末尾に 0 を加えない」で表記する方法はないでしょうか?
結論:予め四捨五入 & 有効数字指定が良いのでは
fmt = '.3g' と指定すると、有効数字 3 桁 (0.583, 0.0833 など) で表示されます。この際は 0 を 0.000 などとは表記しません。なので、あらかじめ小数点以下の桁数を揃えておいてから heatmap の有効数字を指定すれば、上の目的が達成できます。
conf_mat_round = np.round(conf_mat, 3) # あらかじめ小数点以下の桁数を揃える
plt.figure(figsize=(6, 5))
sns.heatmap(conf_mat_round, cmap = 'Blues',
            annot=True, fmt = '.3g') # 有効数字 3 桁で表記
plt.yticks(rotation=0)
plt.show()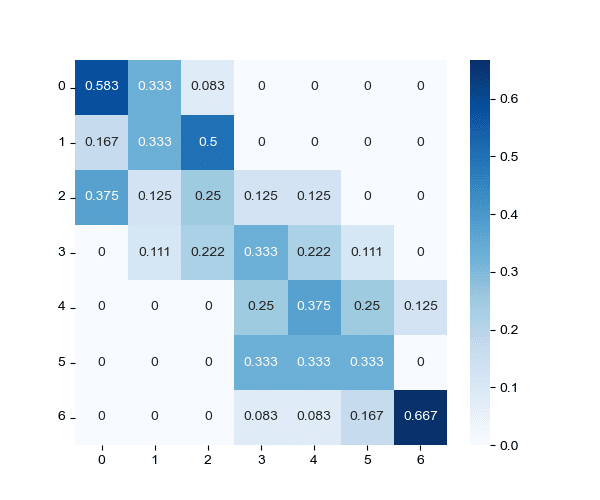
何かの参考になれば幸いです。
3. コード一式
コードを通しで書くと以下のようになります。
import numpy as np
from sklearn.metrics import confusion_matrix
import matplotlib.pyplot as plt
import seaborn as sns
plt.rcParams['font.family'] = 'Arial' # フォントを指定

true = [0, 0, 0, 0, 0, 0, 0, 0, 0, 0, 0, 0, 1, 1, 1, 1, 1, 1, 2,
        2, 2, 2, 2, 2, 2, 2, 3, 3, 3, 3, 3, 3, 3, 3, 3, 4, 4, 4,
        4, 4, 4, 4, 4, 5, 5, 5, 6, 6, 6, 6, 6, 6, 6, 6, 6, 6, 6, 6]
predict = [1, 0, 0, 1, 1, 0, 0, 0, 0, 1, 2, 0, 2, 2, 1, 1, 2, 0, 4,
           0, 0, 3, 1, 2, 0, 2, 4, 4, 1, 2, 2, 3, 5, 3, 3, 6, 4, 5,
           3, 4, 3, 5, 4, 3, 4, 5, 6, 5, 6, 6, 6, 6, 4, 6, 5, 6, 3, 6]

conf_mat = confusion_matrix(true, predict, normalize='true')
conf_mat_round = np.round(conf_mat, 3)

plt.figure(figsize=(6, 5))
sns.heatmap(conf_mat_round, cmap = 'Blues', annot=True, fmt='.3g')
plt.yticks(rotation=0)
# plt.savefig('conf_mat.png') # 図を保存する場合
plt.show()
おまけ:true と predict の生成
以下のように乱数を用いて生成しました。
import numpy as np
np.random.seed(2024)

true, predict = [], []
num_class = 7
for i in range(num_class):
    while True:
        num_i = np.round(7 + np.random.normal(0, 3)).astype(int)
        if num_i >= 1:
            break
    true += [i] * num_i
    predict += [np.round(i + np.random.normal(0, 7+i) / 7).astype(int) for _ in range(num_i)]

true = np.array(true)
predict = np.array(predict)
predict = np.where(predict < 0, 0, predict)
predict = np.where(predict >= num_class, num_class - 1, predict)

print(list(true))
print(list(predict))
[0, 0, 0, 0, 0, 0, 0, 0, 0, 0, 0, 0, 1, 1, 1, 1, 1, 1, 2, 2, 2, 2, 2, 2, 2, 2, 3, 3, 3, 3, 3, 3, 3, 3, 3, 4, 4, 4, 4, 4, 4, 4, 4, 5, 5, 5, 6, 6, 6, 6, 6, 6, 6, 6, 6, 6, 6, 6]
[1, 0, 0, 1, 1, 0, 0, 0, 0, 1, 2, 0, 2, 2, 1, 1, 2, 0, 4, 0, 0, 3, 1, 2, 0, 2, 4, 4, 1, 2, 2, 3, 5, 3, 3, 6, 4, 5, 3, 4, 3, 5, 4, 3, 4, 5, 6, 5, 6, 6, 6, 6, 4, 6, 5, 6, 3, 6]