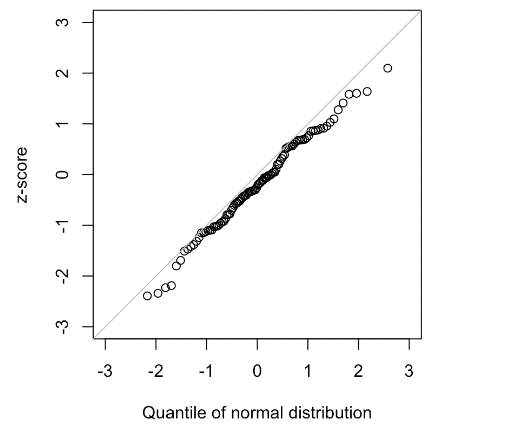
QQプロット
『データサイエンスのための統計学入門・第2版』(オライリー・ジャパン)の75ページに以下のような文章がある。ピンとこないところがあるので調べてみた。
「QQプロットではz値を低いものから高いものに並べ、値のz値をy軸に、値の順位の正規分布に対応する分位数をx軸にとる。データは正規化されるので、平均値から標準偏差単位でどのくらい離れているかがわかる。」
原文は以下の通り。
The QQ-Plot orders the z-scores from low to high and plots each value’s z-score on the y-axis; the x-axis is the corresponding quantile of a normal distribution for that value’s rank. Since the data is normalized, the units correspond to the number of standard deviations away from the mean. If the points roughly fall on the diagonal line, then the sample distribution can be con‐ sidered close to normal.
翻訳では、「データは正規化されるので」となっているが、「データは正規化されているので」でないとわかりにくい。なぜなら、データをプロットする前に正規化はなされている。
「(データは正規化されるので、)平均値から標準偏差単位でどのくらい離れているかがわかる」という部分もよく分からない。原文は単に「単位は、平均からの標準偏差の数に相当する」(the units correspond to the number of standard deviations away from the mean)と書いてあるのであって、y軸の単位について言及しているだけである。データが正規分布から「どのくらい離れているか」ということは、その次の、図の中での対角線との関係の問題なので、翻訳は、原文に忠実であった方が読みやすいと思う。

par(pty="s")

# Standard Normal and QQ-Plots
norm_samp <- rnorm(100)
norm_samp
qqnorm(norm_samp, main='', xlab='Quantile of normal distribution',
ylab='z-score',xlim=c(-3,3),ylim=c (-3,3))
abline(a=0, b=1, col='grey')