統計量の標本分布

『データサイエンスのための統計学入門・第2版』(オライリー・ジャパン)を読んでいる。訳書の63ページに以下のような文がある。
data.framesをバインドしてファクタに型変換
income <- rbind(samp_data, samp_mean_05, samp_mean_20)
income$type = factor(income$type,
levels=c('data_dist', 'mean_of_5', 'mean_of_20'),
labels=c('Data', 'Mean of 5', 'Mean of 20'))
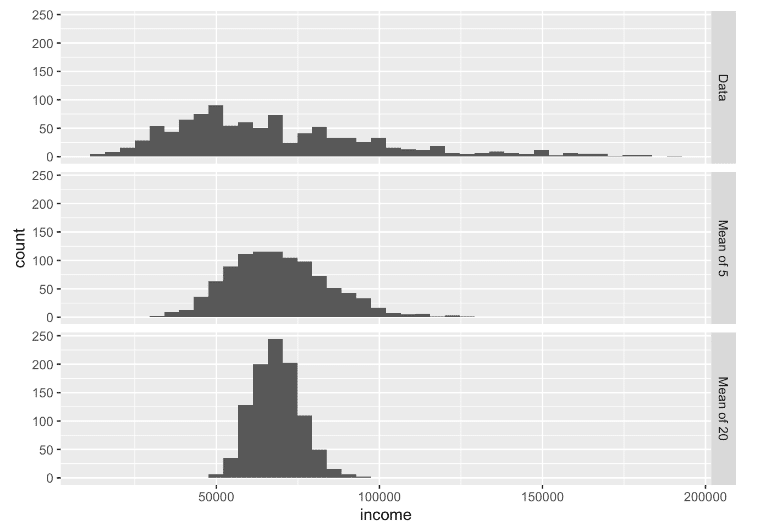
原文は、前後を含めて引用すると以下の通り。ファクタ化するのは、income$typeであって、データフレームincomeの全体ではない。
library(ggplot2)
# take a simple random sample
samp_data <- data.frame(income=sample(loans_income, 1000),
type='data_dist') # take a sample of means of 5 values
samp_mean_05 <- data.frame(
income = tapply(sample(loans_income, 1000*5),
rep(1:1000, rep(5, 1000)), FUN=mean),
type = 'mean_of_5')
# take a sample of means of 20 values
samp_mean_20 <- data.frame(
income = tapply(sample(loans_income, 1000*20),
rep(1:1000, rep(20, 1000)), FUN=mean),
type = 'mean_of_20')
# bind the data.frames and convert type to a factor
income <- rbind(samp_data, samp_mean_05, samp_mean_20)
income$type = factor(income$type,
levels=c('data_dist', 'mean_of_5', 'mean_of_20'),
labels=c('Data', 'Mean of 5', 'Mean of 20'))
# plot the histograms
ggplot(income, aes(x=income)) +
geom_histogram(bins=40) +
facet_grid(type ~ .)
データフレームをバインドすることと、そのバインドされたデータフレームの1項目(変数名はtypeである)をファクタに型変換することとは別のことである。訳文では、「型変換」という語が使われているが、typeという単語(変数名)がどこかに行ってしまっている。データフレーム全体を「型変換」するわけではない。「data.framesをバインドしてファクタに型変換」という訳は明らかにおかしい。