
何百もの地球儀マップのユースケース|Mapbox Globe view

Mapbox Globe viewがリリースされて以来、ユーザーがどんな地球儀マップを作っているのかを探すのはとても楽しいです。この記事では、Mapboxの開発者、デザイナーの皆さんにインスピレーションを与える、お気に入りの作品を集めました。
地球儀マップは、Google Earthが初めて登場したときに感じた好奇心を思い出させてくれます。今回は、開発者が好きなものを作ることができるので、多種多様な地球を探索することができます。
インスピレーションを得たら、ウェブ、iOSまたはAndroid、そしてMapbox Studio用のドキュメントで地球儀プロジェクトを始めてみましょう!90秒のチュートリアル(英語)もあります。
3秒で地球儀マップへ!
地球儀マップを簡単に実装できることは、既存のアプリを見れば明らかです。MacrostratとRiver Runnerのクリエイターによる2つの素晴らしいライブアプリケーションの例をご紹介します。

Trying out the new @Mapbox globe projection on the river runner and seems to be working really well! pic.twitter.com/pndzBBS62K
— Sam Learner (@sam_learner) June 22, 2022
地球儀の美しさの1つは、ポップアップなどのGL JSの機能がそのまま使えることです。Emmanuel Jolaiya氏が試しているものをご覧ください。

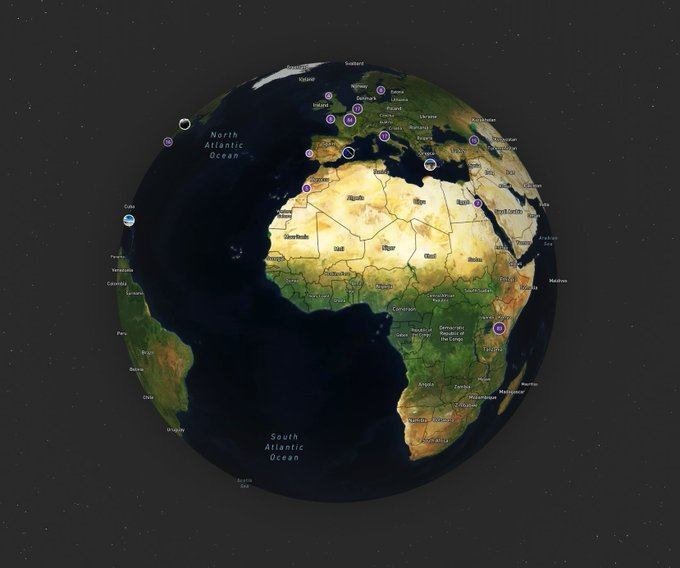
地球儀表示と相性の良いもう一つの機能は、Matt Berg氏の世界の発電所マップに見られるような、カスタムデータレイヤーのデータ駆動型スタイルです。

John Wiseman氏は、航空機のADS-Bトランスポンダーデータから得た世界中のGPS干渉のマップをヒートマップで可視化し、多くの関心を集めました。
Infrastructure Club agent @lemonodor has launched GPSJam - a worldwide map of GPS interference derived from aircraft ADS-B transponder data ✈️📡🚫https://t.co/34RUcQu5r5 pic.twitter.com/nvMAVlcYLQ
— Infrastructure Club (@infraclub) July 26, 2022
Kyle Walker氏の押し出しポリゴンによる地球儀の可視化もご覧ください。
👀👀👀 3D globe with extruded polygons now possible in @Mapbox Studio... #dataviz #gischat pic.twitter.com/d6rqxWPEYV
— Kyle Walker (@kyle_e_walker) June 22, 2022
世界を探検する
地球儀は、回転するインタラクティブなボールによって、場所や地理について考えるための新しい方法となり得ます。
Chris Arderne氏の「Cardinality」は、地形や国の方角を表すグラフとして機能します。
Having fun with the new #mapboxglobe projection. Super valuable feature (hot on the tail of the new projections last year) and again just one line to change. https://t.co/iTUTjUjqph pic.twitter.com/WOU2N4aeNS
— Chris Arderne (@chrisarderne) June 29, 2022
Topi Tjukanov氏とDarren Wiens氏は、地球儀を使って、任意の地点から地球の反対側に何があるのかを探ります。

Globe viewは、新しい視点にもインスピレーションを与えてくれます。鳥瞰図や北を頂点とする2D地図にこだわる必要はありません。
Olwgは、北から見たCO2排出量のビジュアライゼーションに挑戦しています。
The UK’s #CO2emissions as they may be seen from The North..
— Olwg (@Olwgtweets) July 12, 2022
Experimenting with #mapboxglobe to improve the look & feel of how we visualise regional / national #decarbonisation opportunities
🌎 🌍 🌏 pic.twitter.com/SKIiDUzwNj
Jean Baptiste Barré氏の氷河の厚さを表現したビジュアライゼーションは、極地的な視点を持っています。
I've evolved the glacier thickness and velocity visualization into #mapboxglobe. We can finally visualize correctly this global dataset around the #polar regions. By zooming in, you still get the 3D. What a satisfaction! @romain_millan @IGE_Grenoblehttps://t.co/gKClOmnnfO pic.twitter.com/y1hQBF9Eug
— Jean Baptiste Barré (@janbabaa) July 6, 2022
AerisWeatherの開発者による天気図のスニークピークのように、アニメーションもGlobe viewで見ると素晴らしいものになります。
Our developers are having fun combining the new @Mapbox Globe with our global weather mapping layers. Stay tuned for some exciting new mapping capabilities coming from AerisWeather soon! #tgif #mapboxglobe #weathermapping pic.twitter.com/mjLBD7wlHh
— AerisWeather (@AerisWeather) July 1, 2022
地球儀マップ×ストーリーテリング
地球儀の新機能として、ゆっくり回転するエフェクトが搭載され、Nicolas Hoizey氏は写真位置マップを開発しました。
Nono Umasy氏は、歴史愛好家や旅行者のための美しい地球儀を作成しています。カスタムスタイルとベジェ曲線を組み合わせ、マゼランから彼自身の現代の探検まで、地球旅行を表現しています。
https://t.co/U7dmO0jsmo
— ▲⚬▲⚬ (@nonoumasy) July 1, 2022
Integrated Mapbox's new Globe view on HistoryMaps project. Almost no refactoring. Just upgraded my mapbox-gl library and added projection='globe' . That was it!#builtwithmapox #mapboxglobe @Mapbox #javascript #ReactJS #maps #Map #ReactJS pic.twitter.com/z4jUPViYV1
Maps ManiaのKeir Clarke氏は、デジタル化された歴史的な地図をインタラクティブな地球儀にコンバートする方法を紹介しました。
Vintage globe view.https://t.co/Det6LvpyLc
— gmapsmania (@gmapsmania) June 29, 2022
#mapboxglobe pic.twitter.com/weWpytV5Rn
Rudo Kemper氏は、地球儀表示とMapboxストーリーテリングソリューションを組み合わせて、E-デモクラシーの14年にわたる出来事を巡る世界ツアーを作成し、ストーリーテリングを進化させました。
Paul Franz氏は、Crisis Groupによるイランとの海洋関係の緊張状況について説明するために、地球儀をストーリーテリングマップで使用しました。
In case you missed it - explore @CrisisGroup's latest explainer that uses @Mapbox's new cutting-edge globe tech: https://t.co/bCMpbCS3mY #mapping
— Paul Franz (@pkfranz) June 29, 2022
地球儀マップのアーティスト等
Globe viewは、Owen Powell氏のグラフィックノベルスタイルのように、素晴らしいカスタムスタイルの共有に火をつけました。

Steve Attewell氏は、地図ペイントジェネレータStipplerや、仮想国際宇宙ステーションで、すでに地球儀表示のアプリケーションを更に創造的に拡張しています。
Interactive @mapbox globe projection as viewed from the International Space Station #ISS - just an experiment for fun. Interactive version here: https://t.co/iWZbDqIanG pic.twitter.com/MfbnKO0lKZ
— Steve Attewell (@steveattewell) June 28, 2022
最後に#mapboxglobeのツイートでトップだったPratik Yadav氏のフェイスグローブをご紹介します。最高です!!
Am I using the new @Mapbox globe correctly? #mapboxglobe pic.twitter.com/8JAM1pYOlr
— Pratik Yadav (@PrtkYdv) June 29, 2022
もっと地球儀マップのユースケースを見たい方はTwitterで#mapboxglobeのハッシュタグをチェックしてみてくださいね。

*本記事は、Mapbox Inc. Blogの翻訳記事です。
【関連記事】
お問い合わせは下記までご連絡ください
https://www.mapbox.jp/contact