Regarding the safety of cars curve driving Dynamic analysis

Chapter 1 Introduction
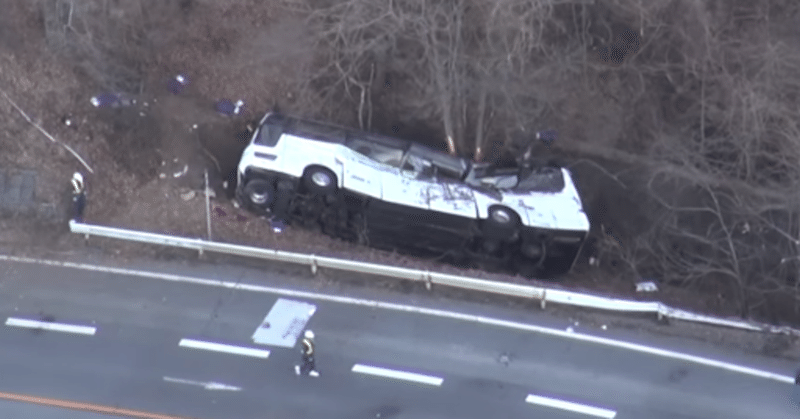
On January 15, 2016, a large bus on a ski tour fell down the road in Karuizawa, driving with 13 university students Two hands killed, 26 seriously injured.
According to the investigation, it was considered that the speed was nearly twice the speed limit on the downhill curve, and that the vehicle could not be controlled, and that the vehicle was leaning and running on one wheel just before the accident. There is.
In addition, automobiles are now widely used by the general public and have become a necessity of life, and such accidents can occur to ourselves at any time.
Even today, where technology has advanced remarkably, slip accidents and rollover accidents when turning a curve are endless.
Preventing such fatal car accidents is a major challenge going forward.
In this study, we examine the limit values of the conditions under which `` lateral slip '' and `` rollover '' occur.
The structure of this paper and the outline of each chapter are described below.
Chapter 1 research background and the structure of this paper.
Chapter 2 Karuizawa bus accident which triggered this research.
Chapter 3 The conventional relations of `` lateral slip '' and `` rollover '' are improved so that analysis including longitudinal gradient and wind force can be performed.
Chapter 4 Collect and determine the data needed to use the formulas described in Chapter 3.
In addition, we collected four road data in Nagano prefecture including Karuizawa as an actual road model.
Chapter 5 The results of examining "lateral slip" and "rollover" based on the formula improved in Chapter 3 and the data in Chapter 4.
Chapter 6 Summarizes the results of Chapter 5.
And state the conclusions of this study.
Chapter 2 About Karuizawa bus accident
This section describes the accident of the ski bus in Karuizawa that triggered this research.(wiki is here)
Around 1:55 AM on January 15, 2016
A large bus for a ski tour hits a guardrail at 96 km / h near the Iriyama Toge on National Route 18 Usui Bypass, Karuizawa-machi, Kitasaku-gun, and fell off the road.
Thirteen college students and two drivers were killed, and 26 were seriously or slightly injured.
The camera image about 250 m before the site records the bus passing at high speed by turning on the brake lamp, indicating that the driver used the foot brake but could not decelerate.
It seems that the engine brake did not work in the neutral state without gears.
In addition, there is the following description of the situation just before the accident and the fall.
①The bus leans to the right and about half of the body crosses the center line
②Fall about 3m below the road with the right side of the bus down
In other words, it falls off the road without turning a curve.
Also, it is probable that the vehicle leaned and rolled over just before the fall.
Based on this accident, we decided to examine two phenomena, `` side slip '' and `` roll over ''.
Chapter 3 Formula for examining the safety of car driving
For the two phenomena of "lateral slip" and "rollover", the limit values such as the radius of gyration and the speed are examined using dynamics.
The formulas shown in 3-1-1 and 3-2-1 were published in the reference materials.In this study, the longitudinal gradient θ and the effect of wind were incorporated into these formulas.
This section describes those equations.
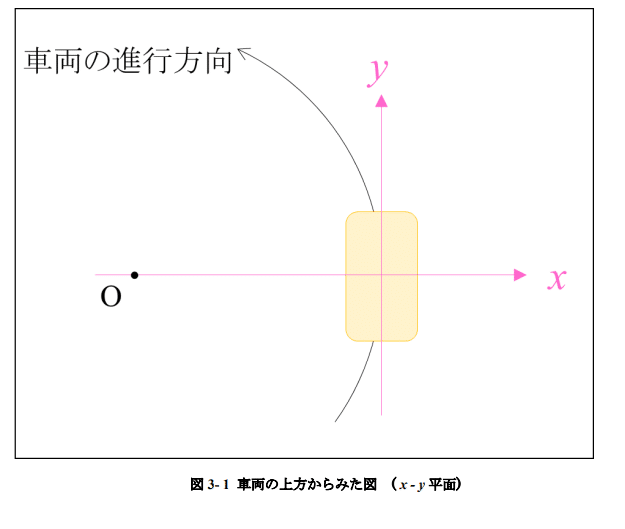
The coordinates use the coordinates (x, y, z axes) of the non-inertial system fixed to the running car.
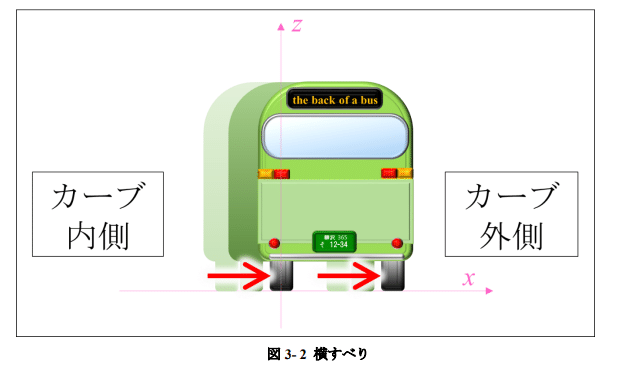
The term `` lateral slip '' in this study refers to the phenomenon in which the vehicle body slides from the inside to the outside due to centrifugal force when turning a curve, as shown in Figure 3-2 below.
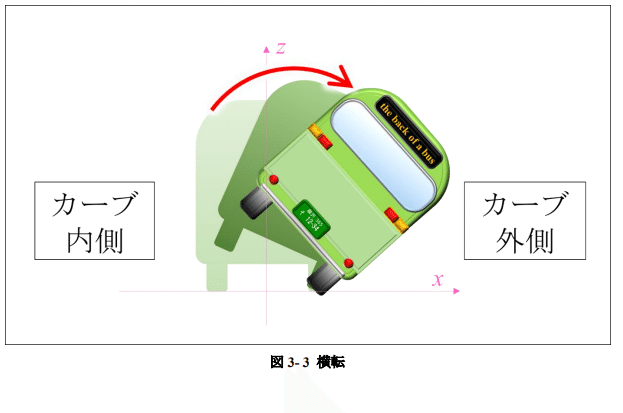
As shown in Figure 3-3 below, rollover in this study refers to the phenomenon in which when turning a curve, the tire inside the vehicle body lifts up mainly due to centrifugal force, causing rotational movement around the outside tire. That is.
3-1 Relational equation of sideslip
The symbols used in the formula are as follows.
・R - Turning radius(m)
・v - Speed(m/s)
・V - Speed(km/h)
・G - Gravitational acceleration(m/s²)
・i - One-sided slope of road (= tanα)
・f - coefficient of sliding friction between road surface and tire against side slip
・F - Friction force (N)
・N - Normal drag (N)
・m - Total weight of vehicle (kg)
・Fc - Centrifugal force (N) (Fc = m𝑣2/𝑅)
・ θ- longitudinal gradient
・D - Wind force (N) (D = CD𝜌U²A/2)
・CD - Lateral force coefficient
・ρ - density of air (kg / m³)
・U - Wind speed (m/s)
・A - rontal projected area of the object (m²)
3-1-1 Original expression
Examine the sideslip of a car.
Consider traveling on a road with a superelevation α and a turning radius R (m) at a constant speed v (m / s).
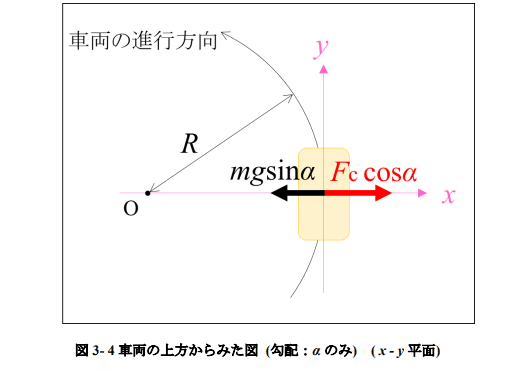
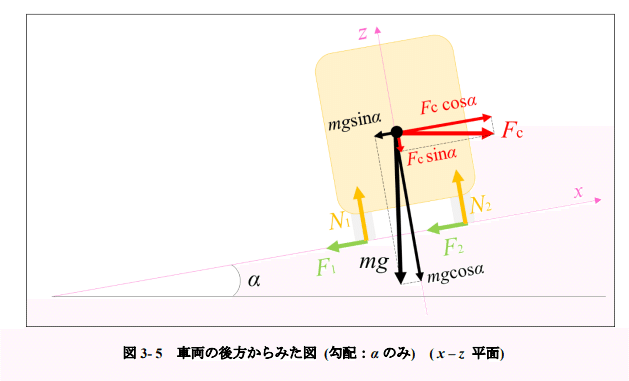
The condition that does not cause sideslip on the x-axis in Fig. 3-5 is the following equation (3-1).
(Frictional force) ≥ (centrifugal force) + (weight) (3-1)
F1 + F2 ≧ Fc cosα – mg sinα (3-2)
f (mg cosα+ Fc sinα) ≧Fc cosα – mg sinα(3-3)
Here, substituting the centrifugal force Fc = m𝑣² / 𝑅 gives
f (mg cosα + m𝑣²sinα / 𝑅) ≧ m𝑣²cosα / 𝑅– mg sinα (3-4)
When 1 / 𝑚𝑔cos𝛼 is applied to both sides.
f (1 + 𝑣²𝑔𝑅 tanα) ≧ 𝑣²𝑔𝑅– tanα(3-5)
If tanα = i
f ( 1+𝑣²i/gR ) ≧𝑣²/𝑔𝑅 – i (3-6)
When organized
f + i ≧𝑣²/𝑔𝑅(1 – f i ) (3-7)
f i is very small compared to 1 and can be considered 0.
f + i ≧𝑣²𝑔𝑅 (3-8)
Solving for R
R ≧𝑣²/𝑔(𝑓+𝑖) (3-9)
Equation (3-9) is an equation to find the critical turning radius R that does not cause side slip when traveling on a road with a sliding friction coefficient f and a one-sided gradient i (= tanα) at a speed v (= 𝑉 / 3.6).
3-1-2 Formula with added vertical gradient θ
The vertical slope θ is added to 3-1-1 to examine the vehicle sideslip.
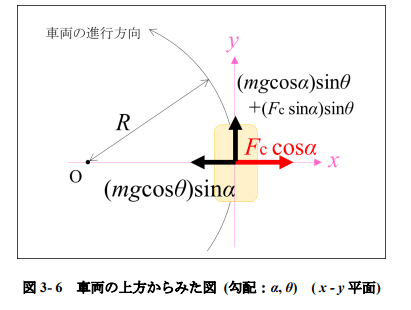
Consider the case of traveling on a road with a single slope α, vertical slope θ, and turning radius R (m) at a constant speed v (m/s).
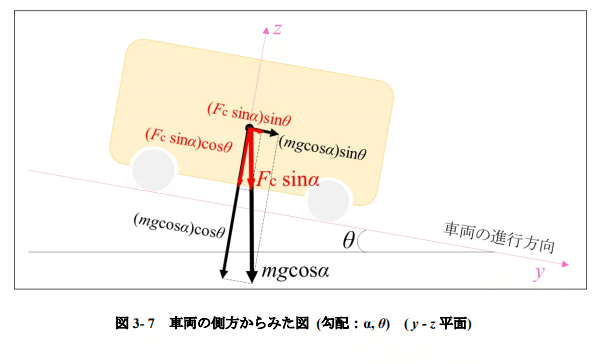
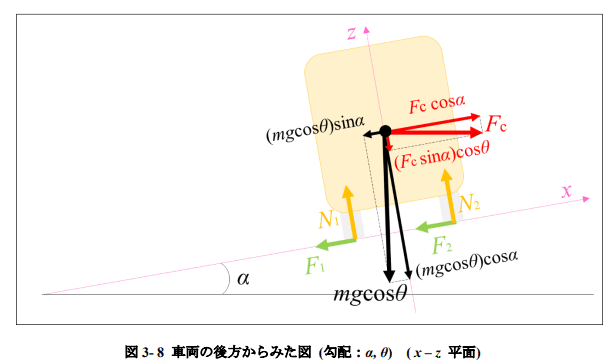
※mg changes with the vertical gradient θ, but the centrifugal force Fc does not change with θ.
However, only the downward force (Fc sinα) of Fc on the z-axis when there is a supergradient α changes with θ.
Consider the condition (Equation 3.1) that does not cause sideslip on the x-axis in Fig. 3-8.
※When considering the centrifugal force Fc, it is necessary to accurately use v cosθ for speed, but in actuality it may accelerate, so we thought that it was v for safety.
(Frictional force) ≥ (centrifugal force) + (weight) (3-1)
F1 + F2 ≧ Fc cosα – mg sinα cosθ (3-10)
f (mg cosθ cosα + Fc sinα cosθ) ≧ Fc cosα – mg sinα cosθ (3-11)
Here, substituting the centrifugal force Fc = m𝑣² / 𝑅 gives
f (mg cosθ cosα + m𝑣²sinα cosθ/R) ≧ m𝑣²cosα/R – mg sinα cosθ (3-12)
When you apply 1/𝑚𝑔cos𝛼 on both sides
f (cosθ+𝑣²tanα cosθ/gR) ≧𝑣²/𝑔𝑅– tanα cosθ (3-13)
If tanα = i
f ( cosθ +𝑣²i cosθ/𝑔𝑅) ≧𝑣²/𝑔𝑅– i cosθ (3-14)
When organized,
( f + i ) cosθ ≧(1 – f i cosθ) 𝑣²/𝑔𝑅 (3-15)
f i is very small compared to 1 and can be considered 0.
( f + i ) cosθ ≧𝑣²/𝑔𝑅 (3-16)
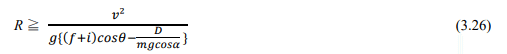
Solving for R gives
R ≧𝑣²/𝑔(𝑓+𝑖)cos𝜃 (3-17)
Equation (3.17) calculates the critical radius of gyration R that does not cause side slip when traveling on a road with a sliding friction coefficient f, a one-sided gradient i (= tanα), and a vertical gradient θ at a speed v (= 𝑉 / 3.6). It is.
3-1-3 Formula with wind force D
The wind power D is added to 3-1-2, and the sideslip of the vehicle is examined.
Consider the case of traveling on a road with a single slope α, vertical slope θ, and turning radius R (m) at a constant speed v (m / s) while receiving a crosswind.
The wind direction is assumed to be perpendicular to the side of the car and outward from the center of the curve, as shown in Figure 3-9 below.

The condition that does not cause sideslip on the x-axis in Fig. 3-9 is given by the following equation (3-18).
(Frictional force) ≥ (centrifugal force) + (weight) + (lateral force of wind)
(3-18)
F1 + F2 ≧ Fc cosα – mg sinα cosθ + D (3-19)
f (mg cosθ cosα + Fc sinα cosθ) ≧ Fc cosα – mg sinα cosθ + D (3-20)
Here, substituting the centrifugal force Fc = m𝑣² / 𝑅 gives
f (mg cosθ cosα + mv²sinα cosθ/R) ≧ m𝑣²cosα/R – mg sinα cosθ + D (3-21)
When you apply 1/𝑚𝑔cos𝛼 on both sides
f (cosθ +𝑣²tanα cosθ/𝑔𝑅) ≧𝑣²/𝑔𝑅– tanα cosθ +𝐷/𝑚𝑔cosα (3-22)
If tanα = i,
f ( cosθ +𝑣²i cosθ/𝑔𝑅) ≧𝑣²/𝑔𝑅– i cosθ +𝐷/𝑚𝑔cos𝛼 (3-23)
When organized,
( f + i ) cosθ -𝐷/𝑚𝑔cos𝛼≧𝑣²(1 – f i cosθ) /𝑔𝑅 (3-24)
f i cosθ is very small compared to 1 and can be considered 0.
( f + i ) cosθ -𝐷/𝑚𝑔cos𝛼≧𝑣²/𝑔𝑅
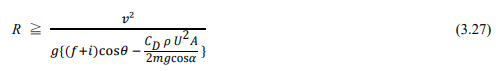
Solving for R gives
Substituting D = CD𝜌U²A/2 gives
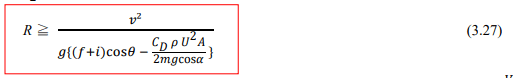
Equation (3.27) is the critical turning radius that does not cause side slip when traveling on a road with slip friction coefficient f, one-sided slope i (= tanα), and vertical slope θ at speed v (= 𝑉 / 3.6) while receiving crosswind. This is the formula for finding R.
Equation (3.27) is an equation for calculating the limit radius of gyration, but similarly, the equation is modified so that the limit values of other elements can be obtained.
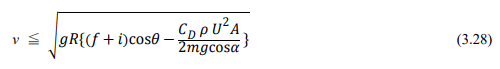
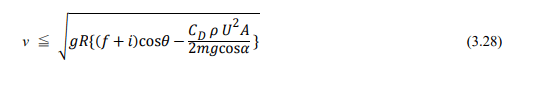
Solving (3.27) for v gives
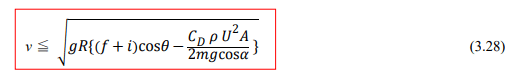
Equation (3.28) is an equation to find the critical speed v that does not cause sideslip.
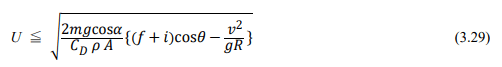
Next, solving (3.27) for U,
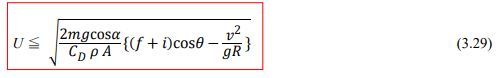
Equation (3.29) is used to determine the critical wind speed U that does not cause sideslip.
3-2 Rollover relation
The symbols used in the formula are as follows
・R - Turning radius(m)
・v - Speed(m/s)
・V - Speed(km/h)
・G - Gravitational acceleration(m/s²)
・α - Gravitational acceleration(m/s²)
・F - Friction force (N)
・N - Normal drag (N)
・m - Total weight of vehicle (kg)
・Fc - Centrifugal force (N) (Fc = m𝑣²/𝑅)
・ H-height of center of gravity (m)
・ W-Distance between left and right wheels (m)
・ θ- longitudinal gradient
・D - Wind force (N) (D = CD𝜌U²A/2)
・CD - Lateral force coefficient
・ρ - density of air (kg / m³)
・U - Wind speed (m/s)
・A - rontal projected area of the object (m²)
・ Z – height of centroid on the side of the vehicle (m)
3-2-1 Original expression
Consider the rollover of a car.
Consider the case of traveling on a road with a superelevation α and a turning radius R (m) at a constant speed v (m / s).
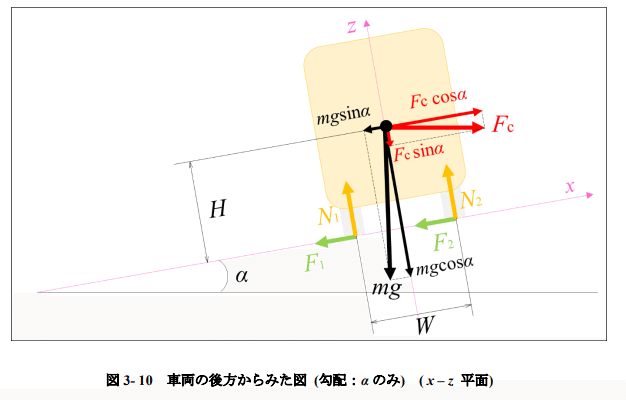
On the x-axis in Fig. 3-10, based on the moment balance of the force at the contact point between the outer wheel and the road surface
![]()
Organize
![]()
Here, substituting the centrifugal force Fc = m𝑣²/𝑅 gives
![]()
Solving for N1
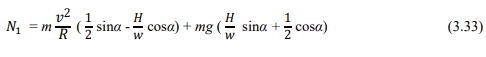
As v increases, centrifugal force Fc = m𝑣²/R increases and 𝑁1 decreases
When 𝑁1 = 0, the inner wheel starts to float.
Then, as a condition that does not cause rollover, 𝑁1 ≥ 0 is applied to equation (3.33).
![]()
Solving for v gives
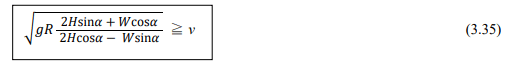
Equation (3.35) is an equation for determining the critical speed v that does not cause rollover when traveling on a road with a one-sided gradient α and a turning radius R.
Considering that sinα is sufficiently smaller than cosα, the following can be said from equation (3.35).
As R or W increases, the critical speed v at which rollover does not occur also increases. In other words, it is more secure.
As H increases, the critical speed v that does not roll over decreases. In other words, it becomes more dangerous.
3-2-2 Equation that adds the vertical gradient θ
The longitudinal gradient θ is added to 3-2-1, and the rollover of the vehicle is examined.
Consider the case of traveling on a road with a single slope α, vertical slope θ, and turning radius R (m) at a constant speed v (m / s).
![]()
Organize
![]()
Here, substituting the centrifugal force Fc = m𝑣²/𝑅 gives
![]()
Solving for N1,
![]()
Here, as a condition that does not cause rollover, 𝑁1 ≧ 0 is applied to equation (3.38).
![]()
Solving for v
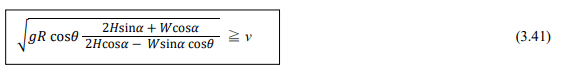
Equation (3.41) is used to find the critical speed v that does not cause rollover when traveling on a road with a single slope α, vertical slope θ, and turning radius R.
3-2-2 Formula with wind force D
Investigate the rollover of the car by adding the wind force D to 3-2-2.
Consider the case of traveling on a road with a single slope α, vertical slope θ, and turning radius R (m) at a constant speed v (m / s) while receiving a crosswind.
The wind direction is assumed to be perpendicular to the side of the car and outward from the center of the curve, as shown in Figure 3.12 below.
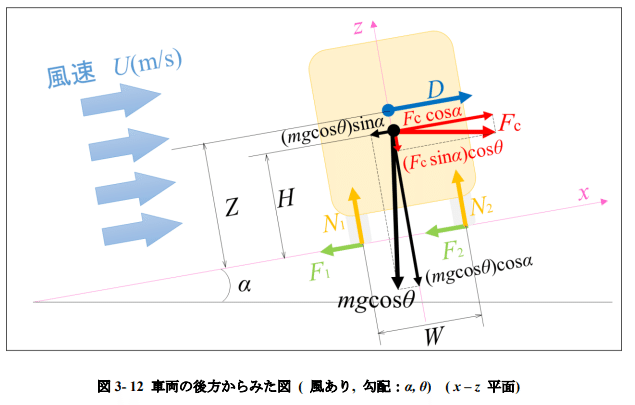
On the x-axis in Fig. 3-12, based on the moment balance of the force at the contact point between the outer wheel and the road surface,
![]()
Organize
![]()
Here, substituting the centrifugal force Fc = m𝑣²/𝑅 gives
![]()
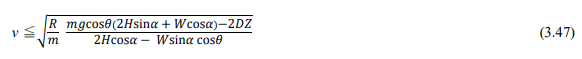
Solving for N1,

Here, as a condition that does not cause rollover, 𝑁1 ≥ 0 is applied to equation (3.44).

Solving for v
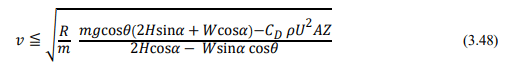
Substituting D = CD𝜌U²A/2 gives
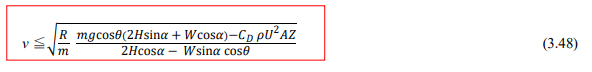
Equation (3.48) is used to find the critical speed v that does not cause rollover when traveling on a road with a single slope α, vertical slope θ, and turning radius R while receiving a crosswind.
Equation (3.48) is used to find the limit speed.Similarly, the equation is modified so that the limit value of the height of the center of gravity can be found.
When 2WR is applied to both sides of equation (3.46),
![]()
When expanded,
To summarize the terms containing H

Solving for H
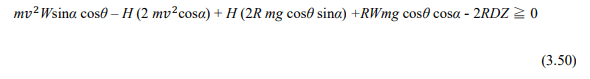
![]()
Substituting D = CD𝜌U²A/2 gives
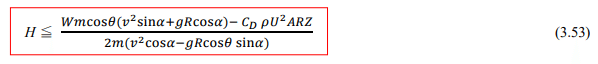
Equation (3.53) is used to find the critical height H of the center of gravity that does not cause rollover.
Chapter 4 Data used for analysis
Various data are required to use the formulas described in Chapter 3. In this chapter, the types and determination methods are described, and the determined data is shown.
4-1 Road
In this study, the following four roads were selected as road models.
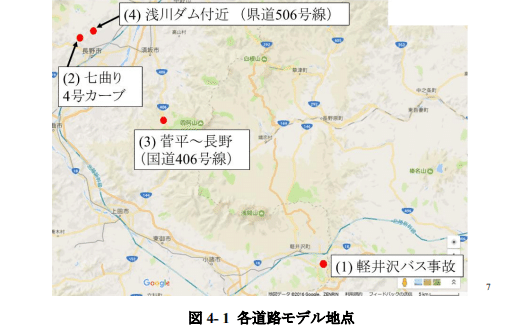
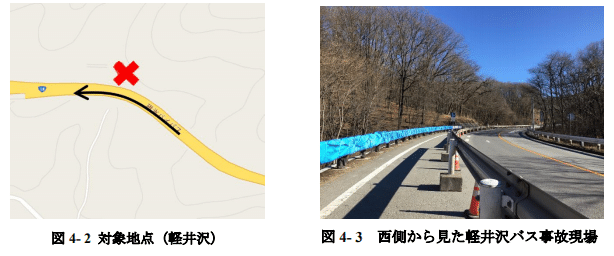
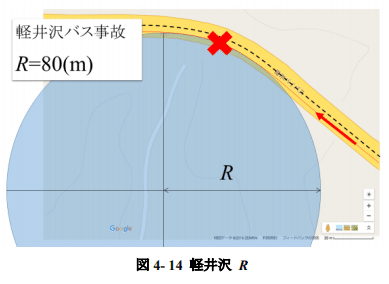
(1) Karuizawa bus accident curve
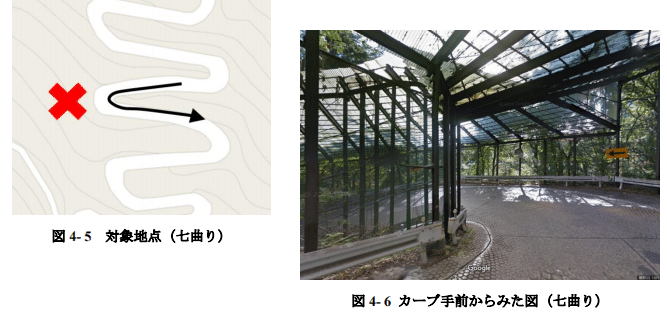
(2) Nanamagari (Nagano City)
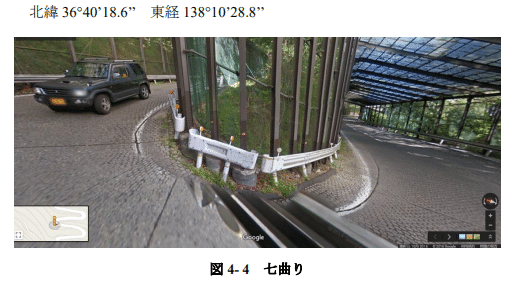
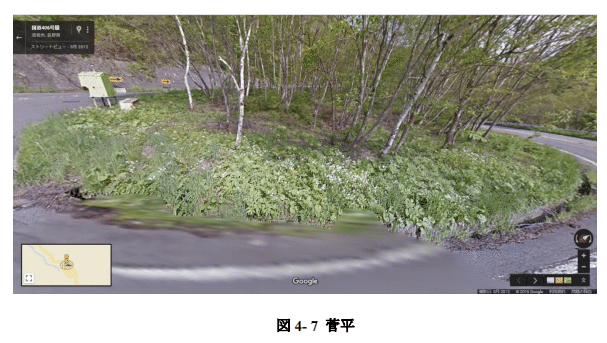
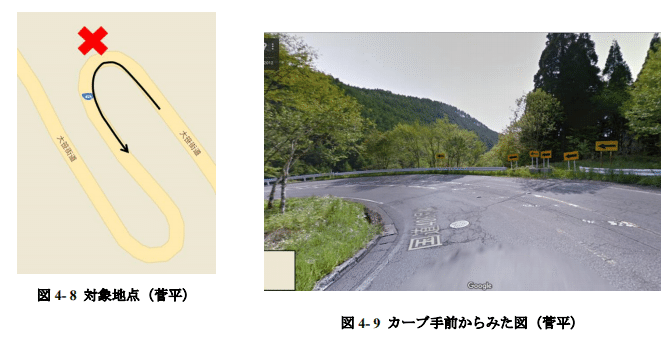
(3) Sugadaira
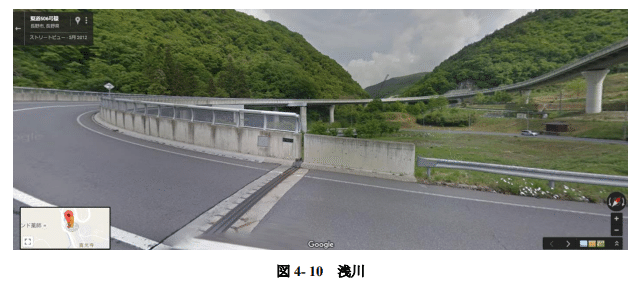
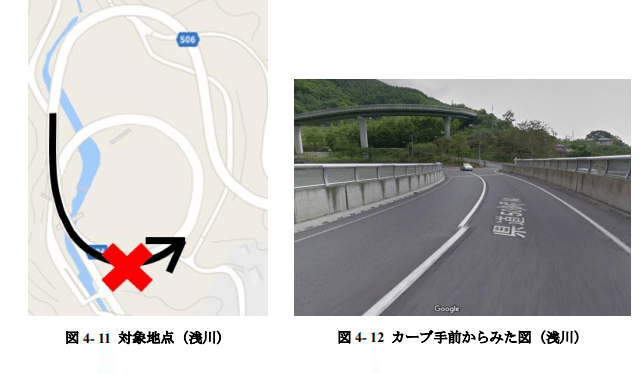
(4) Asakawa
4-1-1 Types of road data and how to determine them
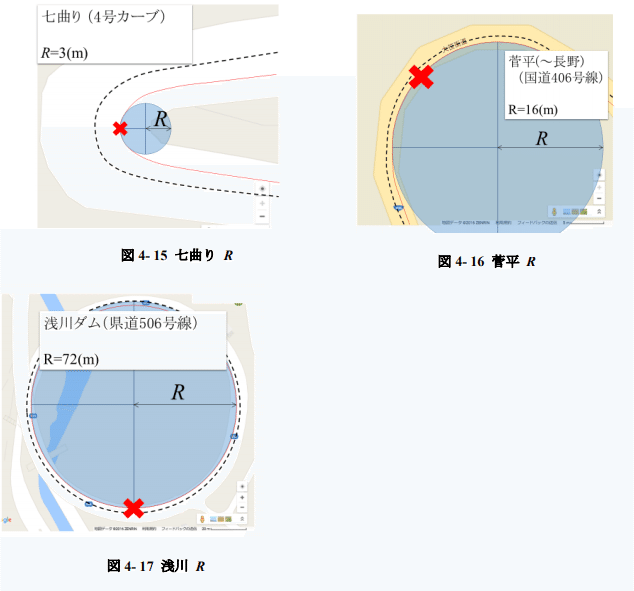
(1) Turning radius R (m)
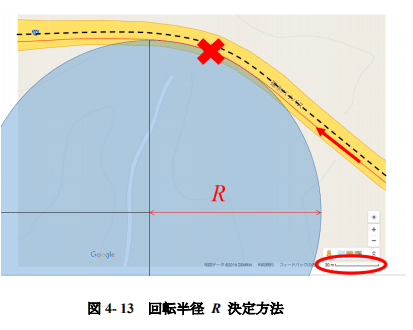
① Draw a line on the running line on the road.
② Draw a circle that best matches the alignment of the target point (x in the figure).
③ Find the radius R (m) of the circle drawn in ② from the scale on the map.
The figure below shows the radius of gyration R of each road obtained by the method described above.
(2) Longitudinal gradient θ
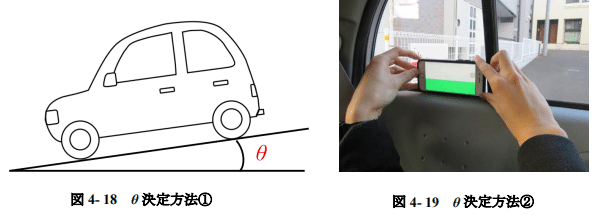
① The vertical gradient θ is defined as positive for the down slope (Fig. 4-18)
(2) After checking the level inside the vehicle, the vehicle was actually run on site and measured.(Fig. 4-19)
(3) Hook-up α
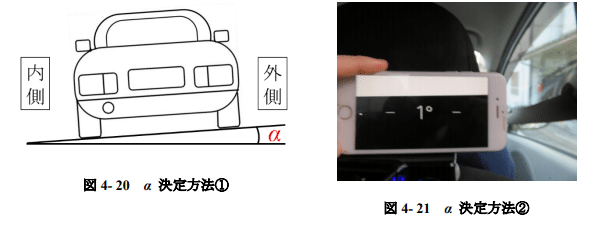
(1) The one-sided gradient α is positive when the gradient outside the curve becomes higher. (Fig. 4-20)
(2) After confirming the horizontal position in the vehicle, the vehicle actually traveled and measured. (Fig. 4-21)
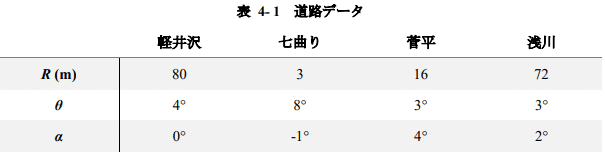
4-1-2 Road data
The measured road data is shown below.
4-2 car
The following four vehicles were selected.
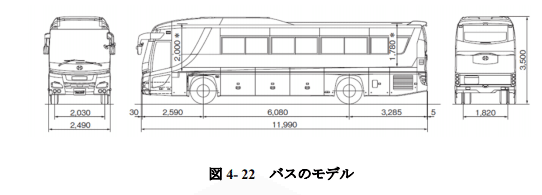
(1) Bus
"Hino Selega RU1ESBA Heidekka Double Row Salon Tour"
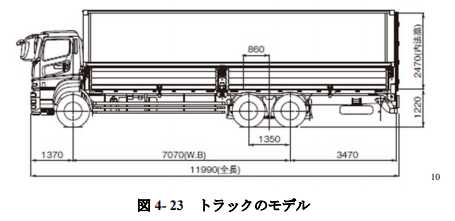
(2) Truck
"QPG-FU64VTZ3XSV (short cab, standard specification)"
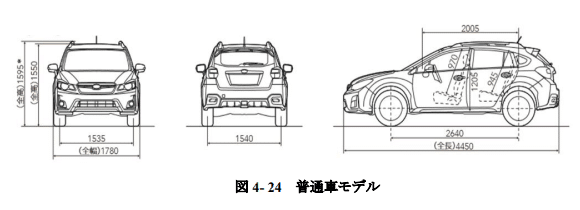
(3) Normal car
「SUBARU HYBRID 2.0i EyeSight」
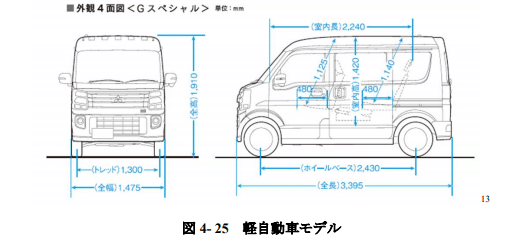
(4) Mini car
"MITSUBISHI MOTORS JAPAN TOWN BOX G Special 2WD"
4-2-1 Types of vehicle data and how to determine them
Vehicle data includes front projected area of vehicle A (m²), distance between left and right wheels W (m), total mass of vehicle m (kg), lateral force coefficient CD, height of vehicle centroid Z (m) Therefore, the height H (m) of the center of gravity of the vehicle was determined.
The following describes the determination method.
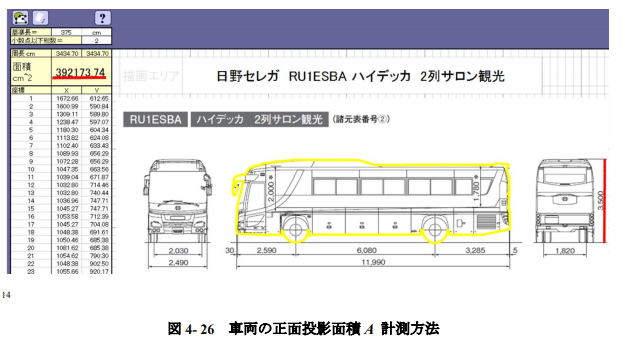
(1) Front projected area of vehicle A (m²)
The front projected area A (m²) of the vehicle can be calculated using software! 0_0! Excel “Length and area measurement” with reference to the vehicle drawing.
(Figure 4-26)
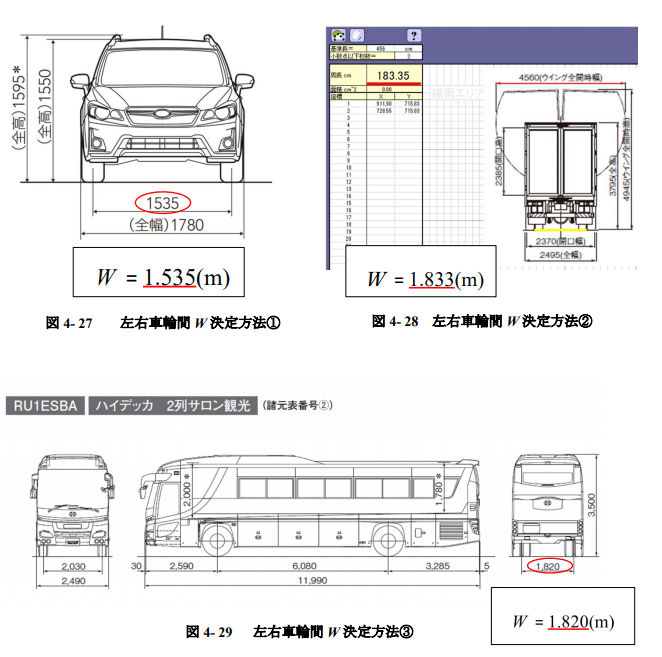
(2) Distance between left and right wheels W (m)
The distance W (m) between the left and right wheels was read from the vehicle drawing. (Figure 4-27)
For those not described in the drawing, refer to the drawing and use the software! 0_0! Excel "Length / Area measurement".(Figure 4-28)
If the distance between the left and right wheels differs between the front and rear wheels, the more dangerous one,
The smaller distance was adopted. (Fig. 4-29)
(3) Total vehicle mass m (kg)
The total mass m (kg) of a vehicle is the sum of the mass of the vehicle and the person when the number of people on board the vehicle, which is 55 kg per person, is added to the mass of the vehicle itself.
However, for trucks, this is the sum of vehicle, person, and maximum load capacity. These are based on the specifications on the website.
However, no description was found for the bus `` Hino Selega RU1ESBA Hidecka Double Row Salon Tour '', so the same type of bus `` Selega (HD) '' was used as a reference.
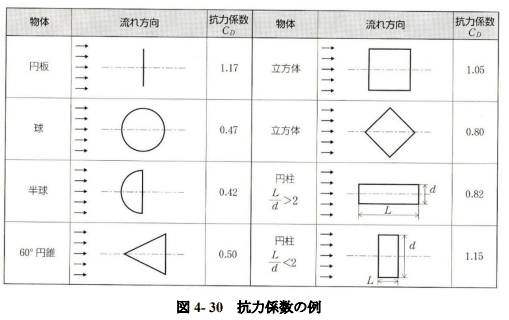
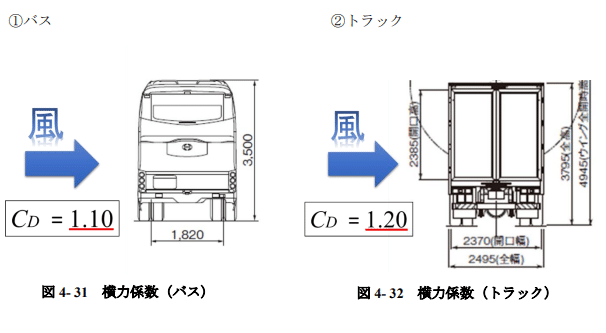
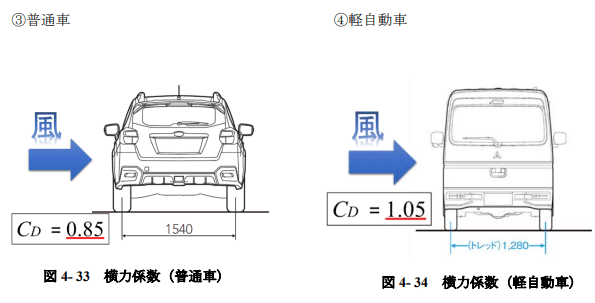
(4) Lateral force coefficient CD
The lateral force coefficient CD is a coefficient that indicates the susceptibility to wind force and depends on the shape of the vehicle.
The assumption was made with reference to the following (Figure 4-30).
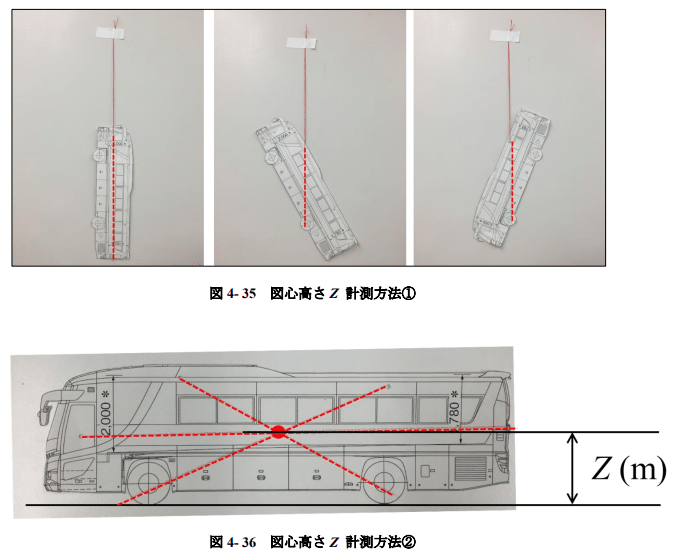
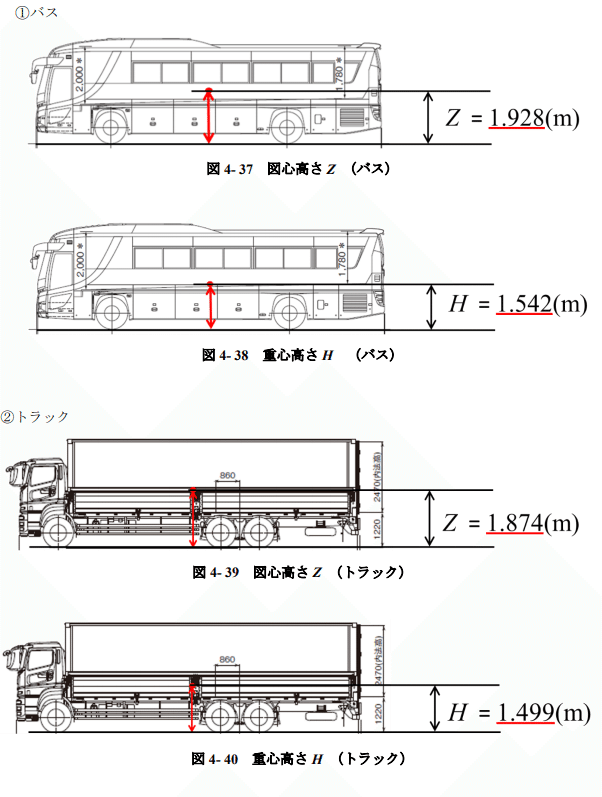
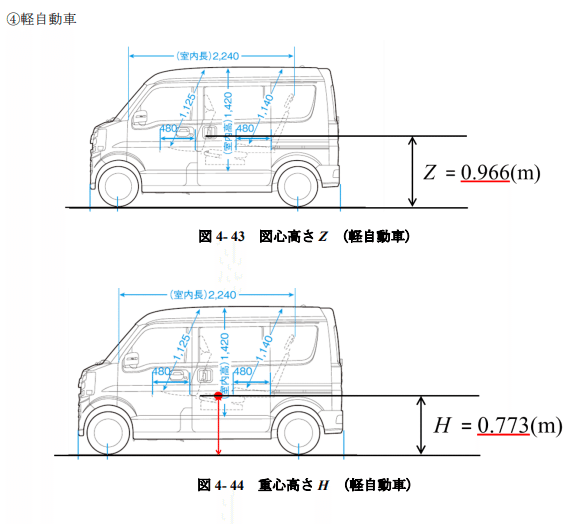
(5) Height of vehicle centroid Z (m)
For the height Z (m) of the vehicle centroid, the centroid of the side of the vehicle assuming that the wind hits was obtained. (Fig. 4-35,36)
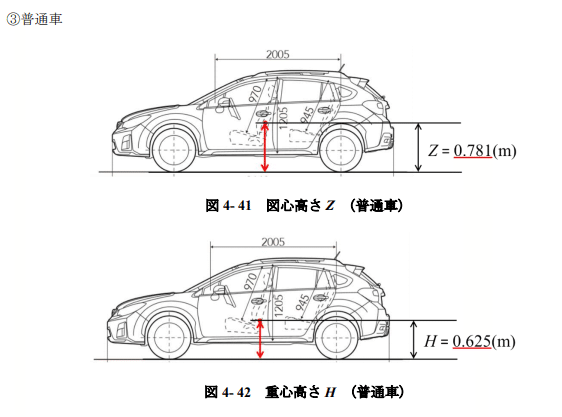
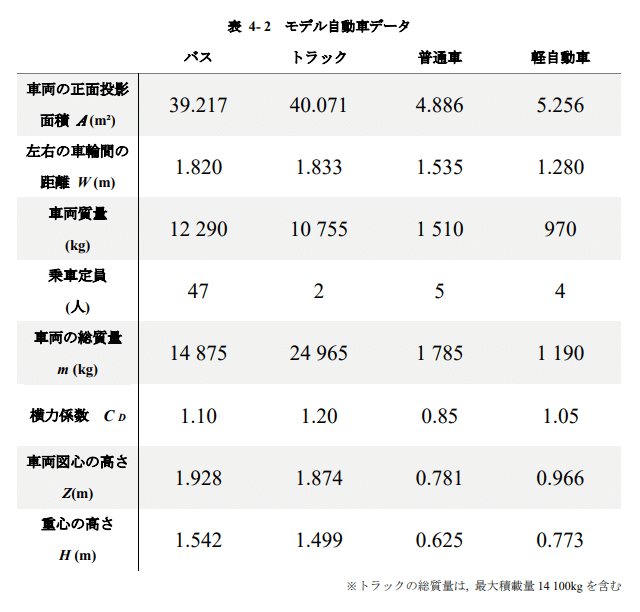
(6) Height of vehicle center of gravity H (m)
The height H (m) of the center of gravity of the vehicle varies depending on the load and riding conditions, but it is assumed that it is located at 4/5 of the centroid height Z.
The figure below shows the centroid height Z (m) and center of gravity height H (m) for each vehicle.
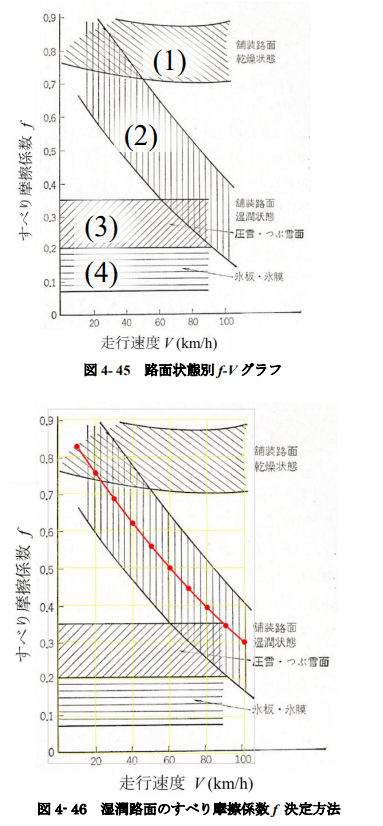
4-2-2 Vehicle data
Vehicle data is shown in the table below
However, the lateral force coefficient 𝐶D and the height of the center of gravity H (m) are assumed as described above.
4-3 Sliding friction coefficient
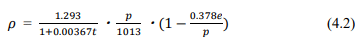
Figure 4-45 below shows the relationship between the vehicle running speed V and the sliding friction coefficient f for each road surface condition.
(1) Dry road surface
According to Figure 4-45, the coefficient of sliding friction f on a dry road surface hardly changes with the running speed V.
In this study, the friction coefficient f on a dry road was set to f = 0.8.
(2) Wet road surface
According to Fig. 4-45, the sliding friction coefficient f on a wet road surface changes greatly with the running speed V.
Therefore, the following equation is applied to determine the sliding friction coefficient f on a wet road surface from the vehicle speed V.
(Figure 4-46)
![]()
f – coefficient of sliding friction
V – Car speed (km / h)
(3) Snowy road surface
According to Figure 4-45, the coefficient of sliding friction f on a snowy road is constant regardless of the running speed V.
In this study, the coefficient of sliding friction f on a snowy road was set to f = 0.25.
(4) frozen road surface
According to Figure 4-45, the coefficient of sliding friction f on a frozen road surface is constant regardless of the running speed V.
In this study, the sliding friction coefficient f on a frozen road surface was set to f = 0.14.
4-4 Meteorological data
Air density 𝜌 (kg / m³) and wind speed 𝑈 (m / s) were used as weather data.
(1) Air density 𝜌 (kg / m³)
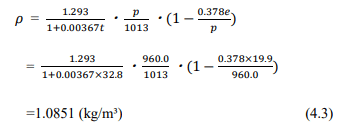
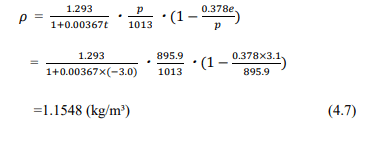
The air density 𝜌 (kg / m³) is expressed by the following equation (4.2).
ρ- Air density (kg / m³)
p-barometric pressure (hPa)
t-Temperature (° C)
e-atmospheric vapor pressure (hPa)
In this study, we used the following air densities
①Dry road model
Weather data at 13:00 on August 12, 2016 in Nagano was used as a model when the road was dry.
Barometric pressure p = 960.0 (hPa)
Temperature t = 32.8 (℃)
Atmospheric vapor pressure e = 19.9 (hPa)
The above data was substituted into equation (4.2) to determine the air density.
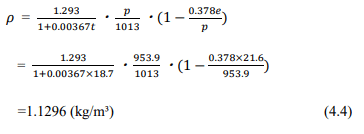
② Model on wet road surface
As a model on a wet road surface, we used weather data from 9:00 on June 13, 2016 in Nagano City.
Barometric pressure p = 953.9 (hPa)
Temperature t = 18.7 (℃)
Atmospheric vapor pressure e = 21.6 (hPa)
The above data was substituted into equation (4.2) to determine the air density.
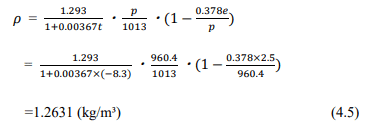
③ Model on snowy road surface
As a model for a snowy road surface, we used weather data at 2:00 on January 25, 2016 in Nagano City.
Barometric pressure p = 960.4 (hPa)
Temperature t = -8.3 (℃)
Atmospheric vapor pressure e = 2.5 (hPa)
The above data was substituted into equation (4.2) to determine the air density.
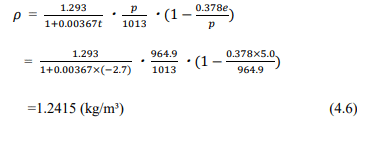
④ Model on frozen road surface
As a model on a frozen road surface, we used weather data at 5:00 on January 8, 2016 in Nagano City.
Barometric pressure p = 964.9 (hPa)
Temperature t = -2.7 (℃)
Atmospheric vapor pressure e = 5.0 (hPa)
The above data was substituted into equation (4.2) to determine the air density.
⑤ Karuizawa bus accident
Karuizawa Weather data for January 15, 2016 2:00 PM
Barometric pressure p = 895.9 (hPa)
Temperature t = -3.0 (℃)
Atmospheric vapor pressure e = 3.1 (hPa)
The above data was substituted into equation (4.2) to determine the air density.
(2) Wind speed U (m / s)
Karuizawa The wind speed U = 2.9 (m / s), which is the weather data at 2:00 on January 15, 2016, is used.
Chapter 5 Results
Using the formulas obtained in Chapter 3 and the data in Chapter 4, we investigated the `` limits '' that do not cause sideslip and rollover, and expressed them in tables and graphs.
5-1 Limit speed that does not cause sideslip
The relational expression when side skidding does not occur is repeated.
Solving for v gives
Solving for U,
In the above equation, the speed V is one of the factors that a person must pay attention to when driving.
Therefore, the speed is treated as a limit value that does not cause sideslip.
Table 5-1 shows the limit speed at which no skidding occurs when driving on a curve at the Karuizawa bus accident site.
* Use equation (3.28).
The wind speed and air density used at the time of the accident (U = 2.9 (m / s), ρ = 1.1548 (kg / m³)) were used.
Also, since it was considered that the road surface did not freeze at the time of the accident, it was calculated as a dry road surface (f = 0.8).
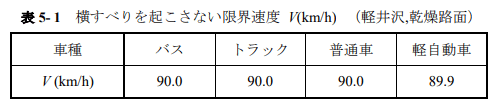
Figure 5-1 shows the relationship between the critical speed V at which the bus does not skid and the turning radius R of the curve when the bus runs on the curve, for each road surface condition.
* On wet roads, the slip friction coefficient f was a function of the speed V, so it was necessary to provide the speed V in advance to apply it to the formula.
Therefore, using equation (3.27), after determining the speed, the critical radius at that time was obtained, and the speed was represented on the vertical axis. The wind speed, one-sided gradient, and longitudinal gradient were one (U = 2.1 (m / s), α = 1 °, θ = 2 °).
The density of the air was determined according to the road conditions (see 4-4).
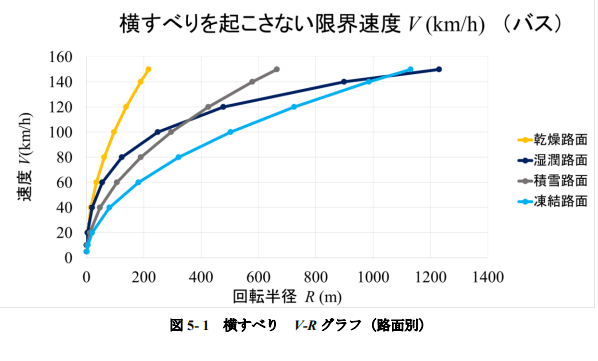
The sliding friction coefficient f of the three non-wet road surfaces is constant (dry road surface f = 0.8, snowy road surface f = 0.25, frozen road surface f = 0.14), whereas the sliding friction coefficient f of wet road surface f increases.
Therefore, it shows a different tendency from the other graphs because it decreases (see 4-3).
On a wet road, when the speed reaches about 110 km / h, it is comparable to a snow-covered road,
When the speed reaches about 145 km / h, it can be seen that it becomes easier to slip on a frozen road surface.
Fig. 5-2 shows the case where the critical radius R in Fig. 5-1 is small.
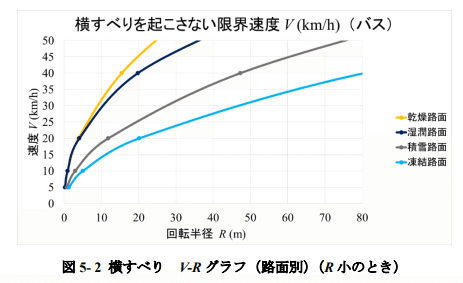
Figure 5-3 shows the relationship between the critical speed V at which no side slip occurs and the radius of gyration R of the curve when the bus runs on the curve, for each of the slopes α.
* Equation (3.28) was used. Calculation was performed on a dry road surface (f = 0.8). The wind speed and longitudinal gradient were constant (U = 2.1 (m / s), θ = 4 °). (See 4-4).
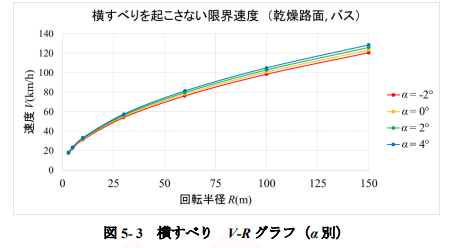
It can be seen that the limit speed increases at a nearly constant rate as the superelevation α increases.
Figure 5-4 shows the relationship between the critical speed V at which no side slip occurs and the turning radius R of the curve when the bus runs on the curve, for each vertical gradient θ.
* Equation (3.28) was used. Calculated as dry road surface (f = 0.8). Wind speed and one-sided gradient are constant (U = 2.1 (m / s), α = 0 °)
It was.
For the density of the air, the model for a dry road was used (see 4-4)
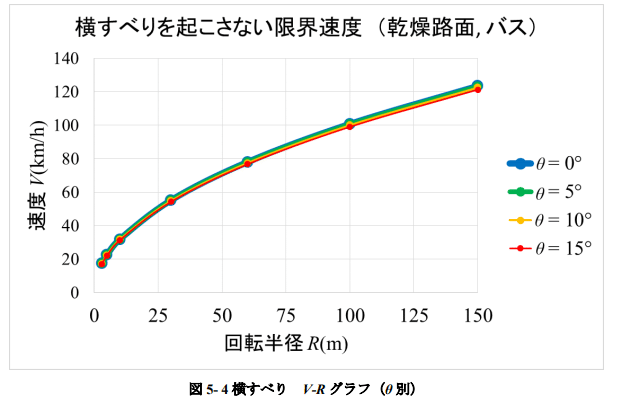
We anticipated that the reduction of the vertical drag due to the vertical gradient θ would reduce the frictional force and make it more susceptible to wind forces. However, there was little change in this range due to the vertical gradient.
Here, it should be noted that in this study the vehicle is accelerated when there is a vertical gradient, while the speed is kept constant.
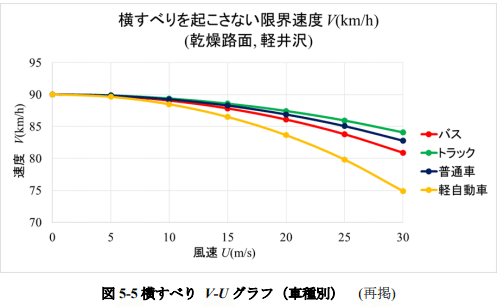
Figure 5-5 shows the relationship between the limit speed V and the wind speed U, which does not cause skidding, when the car travels on a curve at the Karuizawa bus accident site.
* Use equation (3.28). Dry road surface (f = 0.8), air density used at the time of the accident (see 4-4).
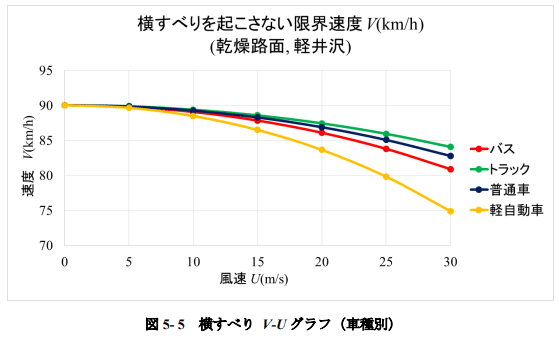
Figure 5-6 shows the relationship between the critical speed V and the wind speed U at which no side slip occurs when the truck runs on a curve at the Karuizawa bus accident site, for each road surface condition f.
* Equation (3.29) is used. The density of the air is based on the road surface condition (see 4-4).
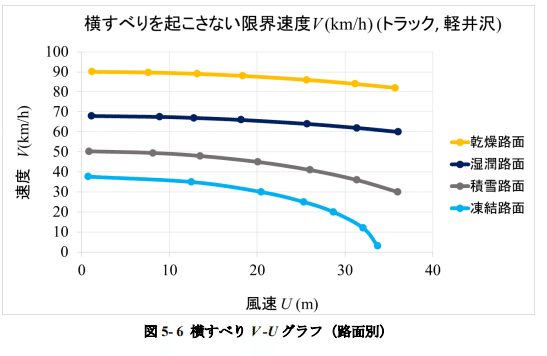
Figure 5-7 shows the relationship between the critical speed V and the wind speed U at which no side slip occurs when the truck runs on the curve at the Karuizawa bus accident site, for each frontal area A on the side of the vehicle.
Is used because the projected area A and the mass m can be easily changed.
* Use equation (3.28). Dry road surface (f = 0.8), air density used at the time of the accident (see 4-4).
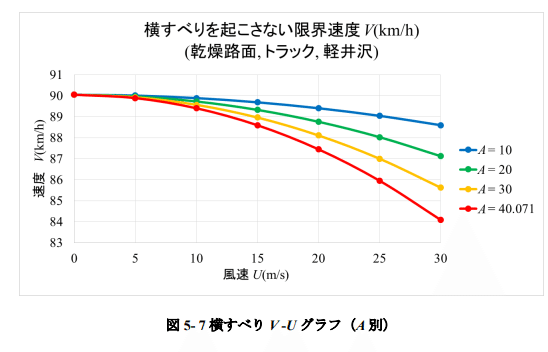
Figure 5-8 shows the relationship between the critical speed V and the wind speed U, which does not cause skidding, when the truck runs on the curve at the Karuizawa bus accident site, for each vehicle mass m.
* Use equation (3.28). Dry road surface (f = 0.8), air density used at the time of the accident (see 4-4).
* M = 24 965 (vehicle + maximum occupancy + maximum load capacity), m = 10 810 (vehicle + 1 maximum occupant)
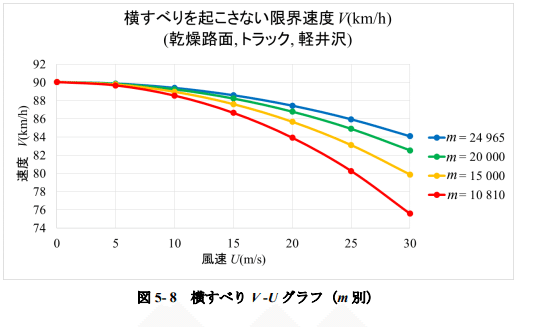
Figure 5-9 shows the relationship between the critical speed V and the wind speed U at which no side slip occurs when the truck runs on a curve at the Karuizawa bus accident site, for each lateral force coefficient CD.
* Use equation (3.28). Dry road surface (f = 0.8), air density used at the time of the accident (see 4-4).
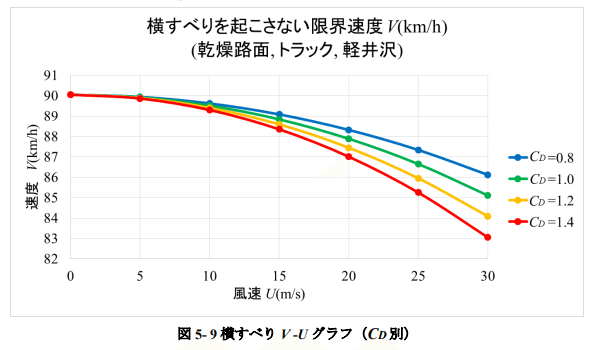
Figure 5-10 shows the relationship between the critical speed V and the wind speed U that does not cause skidding when the truck travels on a curve at the Karuizawa bus accident site, for each of the slopes α.
* Use equation (3.28). Dry road surface (f = 0.8), air density used at the time of the accident (see 4-4).
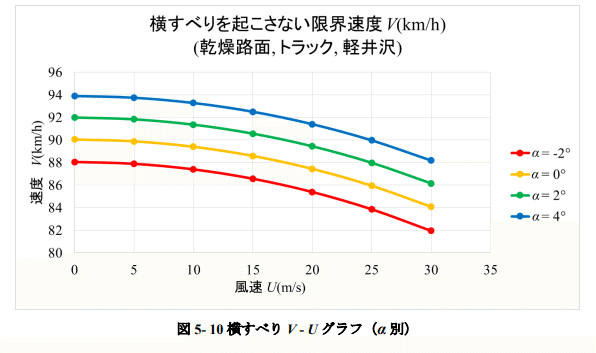
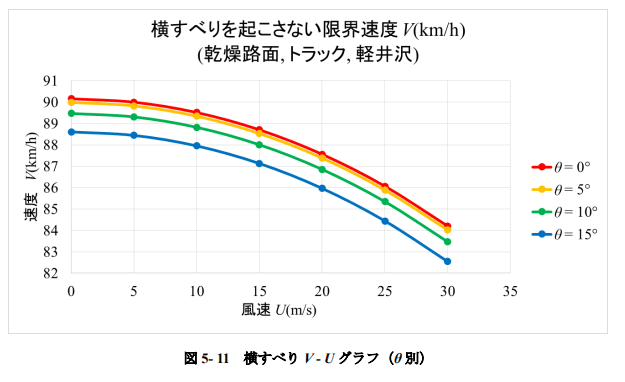
Figure 5-11 shows the relationship between the critical speed V and the wind speed U at which the truck does not skid when traveling on a curve at the Karuizawa bus accident site, for each vertical gradient θ.
* Use equation (3.28). Dry road surface (f = 0.8), air density used at the time of the accident (see 4-4)
5-2 rollover
The relational expression when rollover does not occur is reprinted.

Solving for H gives

In the above equation, the factors that the person must pay attention to when driving are the speed V and the height of the center of gravity H.
Therefore, the velocity V and the height H of the center of gravity are treated as limit values that do not cause rollover.
5-2-1 Limit speed without rollover
The following table / graph used equation (3.48). Unless otherwise stated, the wind speed and air density used at the time of the accident (U = 2.9 (m / s), ρ = 1.1548 (kg / m³)) were used.
Tables 5-3 to 5-6 show the critical speeds that do not cause rollover when traveling on curves on each model road.
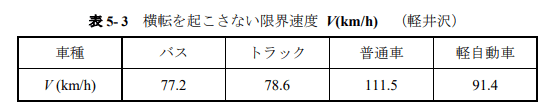
According to Table 5-3, when the bus travels along the curve at the Karuizawa bus accident site, it does not roll over up to 77.2 km / h. If the bus at the time of the accident was running at 96 km / h, it had rolled over. Conceivable.
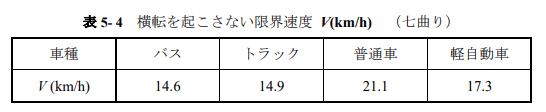
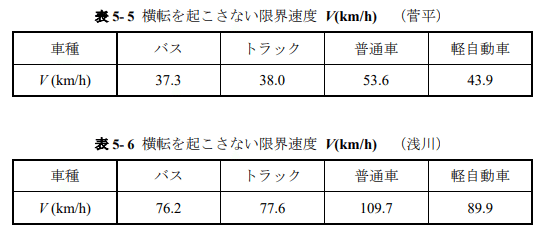
The difference between the roads is largely due to the difference in the turning radius R of the road.
(Karuizawa R = 80, Seven turns R = 3, Sugadaira R = 16, Asakawa R = 72)
In addition, differences in vehicle types are largely due to differences in the height of the center of gravity of each vehicle.
When considering the height of the center of gravity, it is important to compare the ratio of the height H of the center of gravity to the distance W between the left and right wheels (H / W).
is there.
Table 5-7 below shows the calculated H / W of each car.
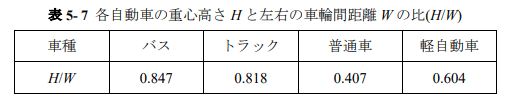
According to Table 5-7, the descending order of H / W, that is, the order in which rollover is likely to occur, is bus, truck, minicar, ordinary car.
Fig. 5-12 shows the relationship between the critical speed V and the turning radius R at which the vehicle does not roll over when traveling on a curve, by vehicle type. 2 °, α = 1 °)
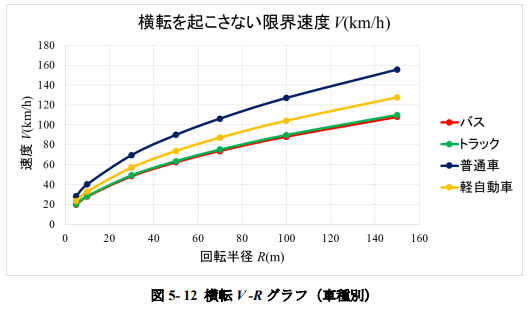
Fig. 5-13 shows the relationship between the height of the center of gravity H / W with respect to the distance between the left and right wheels and the corresponding limit speed V by changing the height of the center of gravity of each vehicle. If the values are the same, there is little difference between the car types.
However, even when the H / W values are the same, there are differences between the vehicle types in strong winds (see Figure 5-29).
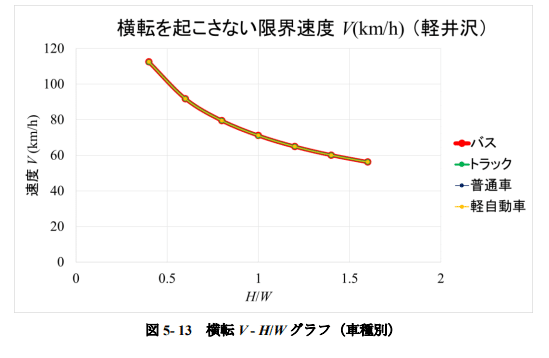
Figure 5-14 shows the relationship between the critical speed V at which the vehicle does not roll over and the radius of gyration R when the vehicle is running on a curve, with respect to the distance between the left and right wheels and the height of the center of gravity H / W.
Longitudinal gradient, single gradient is constant. (Θ = 2 °, α = 1 °)
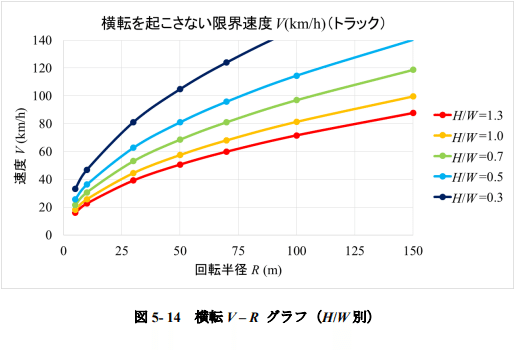
Figure 5-15 is an enlarged view of the range of Fig. 5-14 where the turning radius R is small.
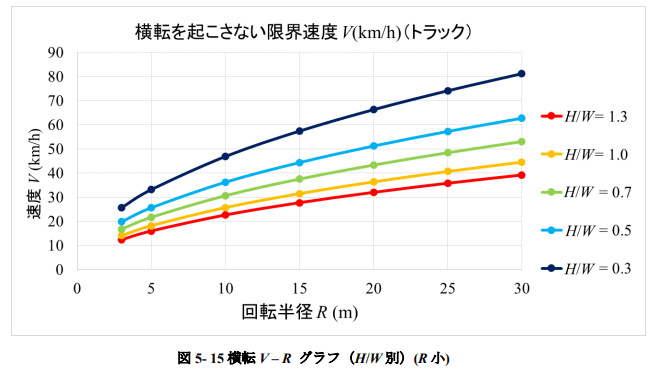
Fig. 5-16 shows the relationship between the critical speed V at which the vehicle does not roll over and the radius of gyration R when the vehicle is running on a curve, with a single gradient α. The longitudinal gradient is fixed. 2 °)
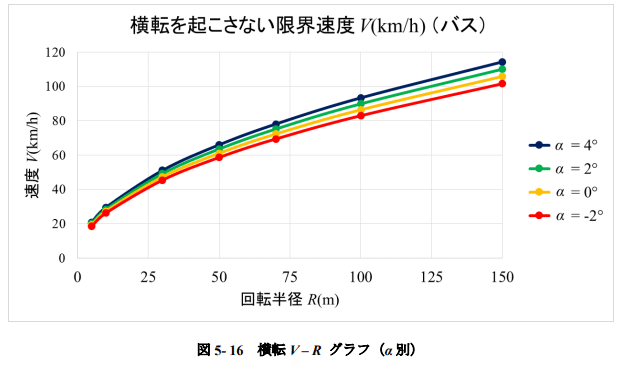
Figure 5-17 shows the relationship between the critical speed V at which the vehicle does not roll over and the radius of gyration R for each longitudinal gradient θ when the vehicle is running on a curve. 2 °)
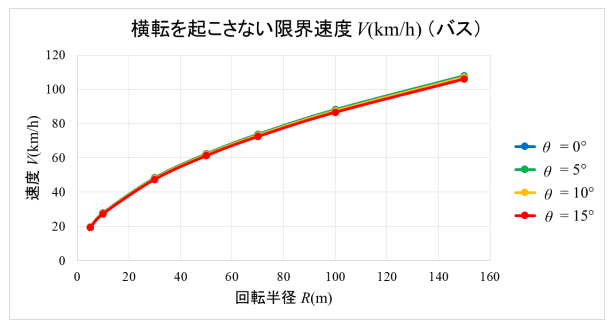
Figure 5-18 shows the relationship between the critical speed V and the wind speed U at which the car does not roll over when traveling on a curve at the Karuizawa bus accident site.
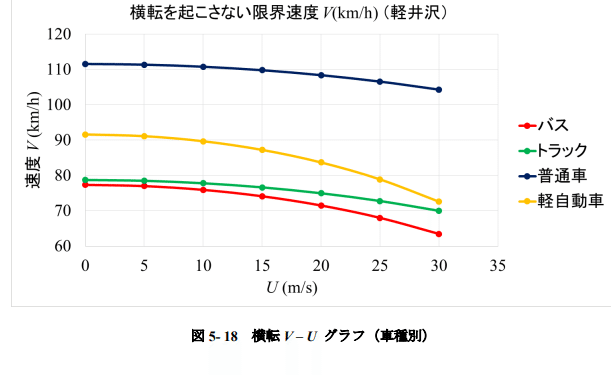
Figure 5-19 shows the relationship between the critical speed V and the wind speed U at which the truck does not roll over when traveling on a curve at the Karuizawa bus accident site, by the height of the center of gravity H / W with respect to the distance between the left and right wheels. is there.
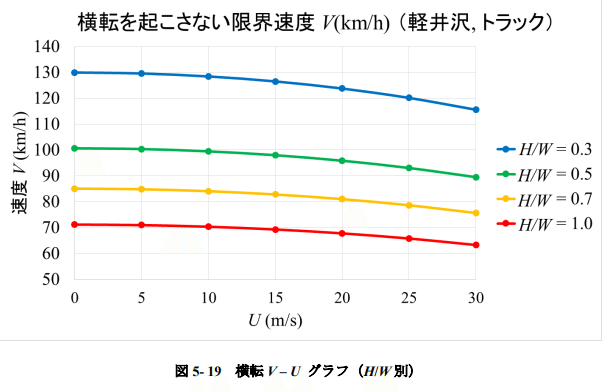
Figure 5-20 shows the relationship between the critical speed V and the wind speed U at which the truck does not roll over when traveling on a curve at the Karuizawa bus accident site, for each front projected area A on the side of the vehicle.
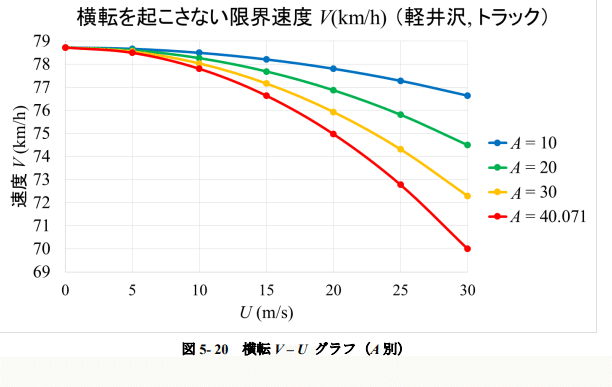
Figure 5-21 shows the relationship between the critical speed V and the wind speed U at which a truck does not roll over when traveling on a curve at the Karuizawa bus accident site, for each vehicle mass m.
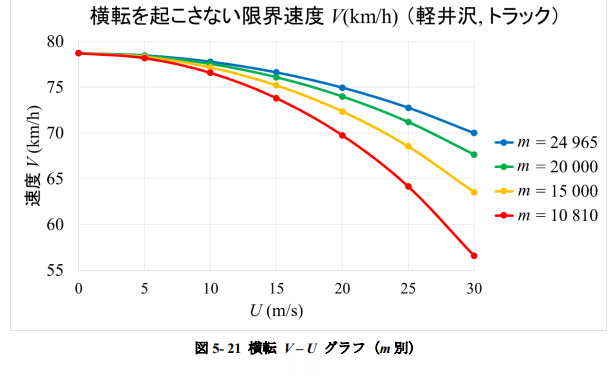
Figure 5-22 shows the relationship between the critical speed V and the wind speed U at which the truck does not roll over when traveling on a curve at the Karuizawa bus accident site, for each lateral force coefficient CD.
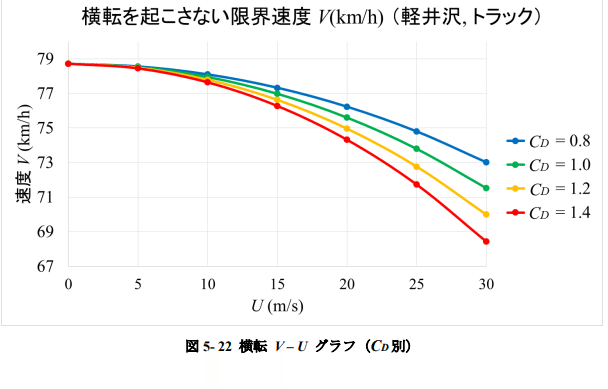
Figure 5-23 shows the relationship between the critical speed V and the wind speed U at which the truck does not roll over when traveling on a curve at the Karuizawa bus accident site, for each of the slopes α.
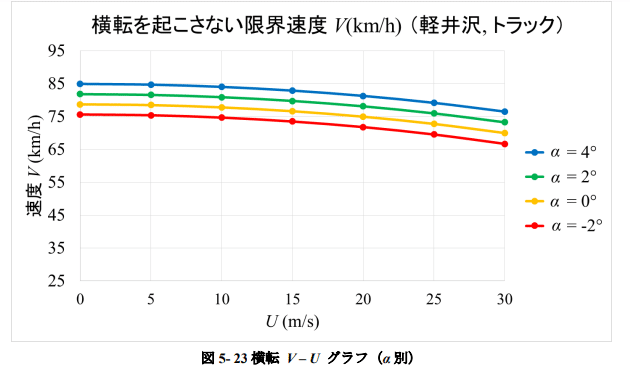
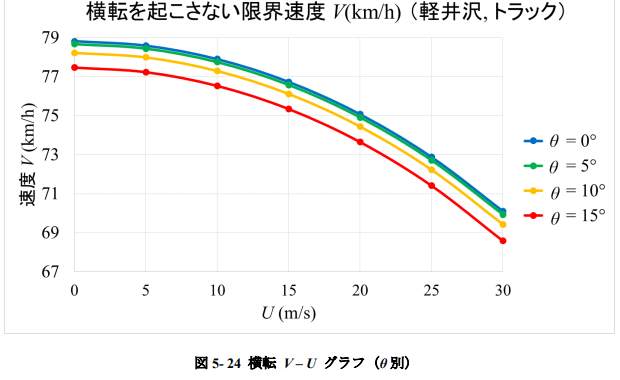
Figure 5-24 shows the relationship between the critical speed V and the wind speed U at which the truck does not roll over when traveling on a curve at the Karuizawa bus accident site, for each vertical gradient θ.
5-2-2 Critical height of center of gravity without rollover
The following table / graph used the equation (3.53).
Unless otherwise stated, the wind speed and air density are those at the time of the accident (U = 2.9 (m / s), ρ = 1.1548 (kg / m³)).
Table 5-8 shows the critical height H of the center of gravity that does not roll over when the car is traveling at a curve at the Karuizawa bus accident site at 100 km / h.
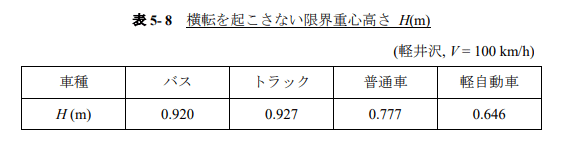
Table 5-9 shows the critical height H of the center of gravity in Table 5-8 converted to the ratio H / W to the distance W between the left and right wheels of each car.
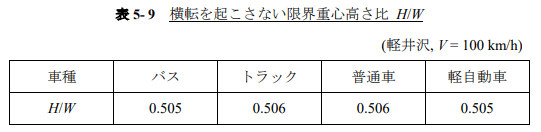
Although the height of the center of gravity of the bus that caused the actual accident is unknown, the height ratio of the center of gravity of the bus assumed in this study is H / W = 0.847, which exceeds the critical height ratio of the center of gravity. It is possible that it was awake.
Table 5-10 shows the critical height H of the center of gravity that does not roll over when the car is traveling at a curve at the Karuizawa bus accident site at a speed of 50 km / h (speed limit).
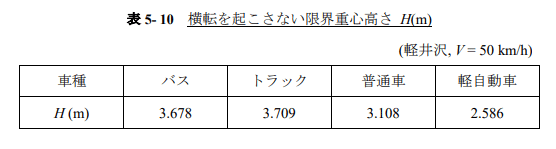
Table 5-11 shows the critical height H of the center of gravity in Table 5-10 converted to the ratio H / W to the distance W between the left and right wheels of each vehicle
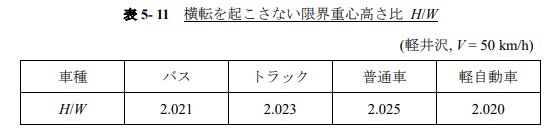
It can be said that if the vehicle travels on this curve in Karuizawa at the speed limit, it does not roll over even if the height of the center of gravity is approximately twice as high as the distance between the left and right wheels.
Fig. 5-25 shows the relationship between the critical center-of-gravity height ratio H / W that does not cause rollover and the speed V when the bus runs on a curve, for each radius of gyration R. (θ = 2 °, α = 1 °)
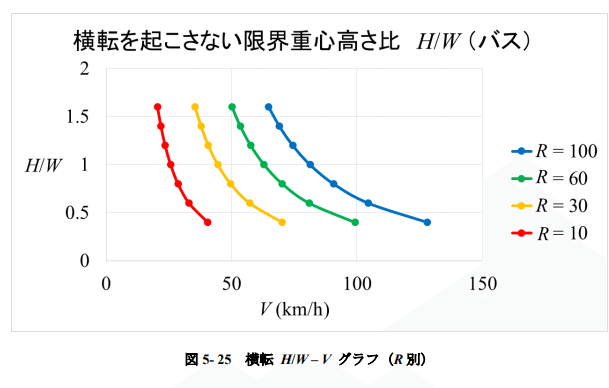
Figure 5-26 shows the relationship between the critical center-of-gravity height ratio H / W that does not cause rollover and the radius of gyration R when the car is running on a curve at a speed of 60 km / h.
Longitudinal gradient / side gradient is constant. (Θ = 2 °, α = 1 °)
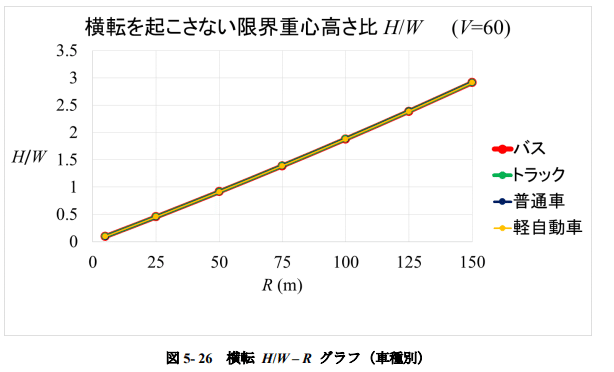
If the value of H / W is the same, there is almost no difference between the vehicle types
Fig. 5-27 shows the relationship between the critical center-of-gravity height ratio H / W that does not cause rollover and the radius of gyration R when the bus travels on a curve at 60 km / h for each one-sided gradient α.
Longitudinal gradient is constant. (Θ = 2 °)
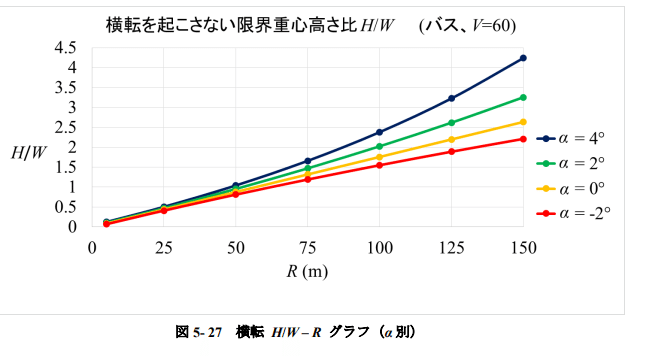
Figure 5-28 shows the relationship between the critical center-of-gravity height ratio H / W that does not cause rollover and the radius of gyration R for each vertical gradient θ when the bus runs at 60 km / h on a curve.
The slope is constant. (Α = 1 °)
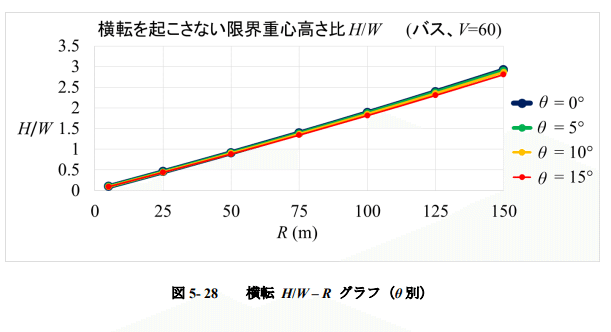
Figure 5-29 shows the relationship between the critical center-of-gravity height ratio H / W that does not cause rollover and the wind speed U when the vehicle runs on the Karuizawa Bus Accident Curve at 100 km / h for each vehicle type.
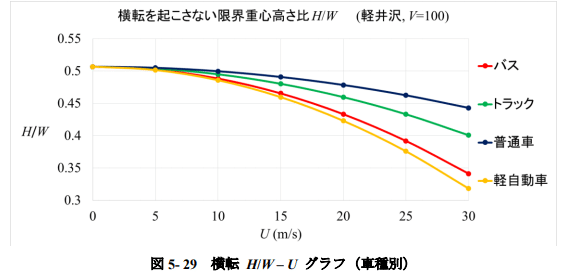
Figure 5-5 (re-listed below) shows the relationship between the critical speed V and the wind speed U that does not cause skidding for each vehicle type. Differences are seen in the order of susceptibility.
The influence of the wind force on the sideslip was mainly determined by the mass m of the car, the front projected area A, and the lateral force coefficient CD.However, when considering the wind force against the rollover, the centroid height Z Also receiving the power of the wind
It is thought that it affects the simplicity.
The centroid height Z was used as the position to receive the wind force when considering rollover as a moment of force. In other words, when considering the effect of wind on rollover,
You also need to consider that higher cars are more susceptible to wind forces.
In Fig. 5-29, it is considered that the reason why the truck became more affected by the wind than the ordinary car was.
Figure 5-30 shows the relationship between the critical center-of-gravity height ratio H / W that does not cause rollover and the wind speed U when the truck runs on the Karuizawa bus accident curve at 100 km / h for each front projected area A on the side of the vehicle. is there.
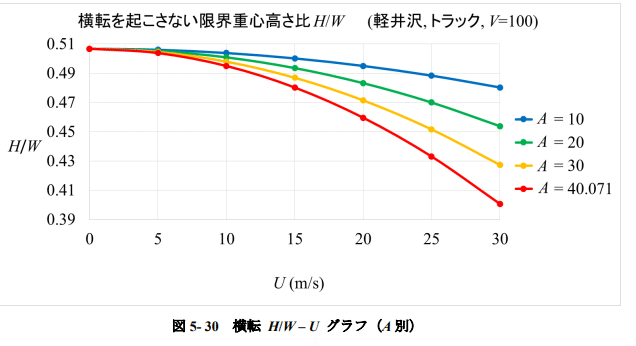
Figure 5-31 shows the relationship between the critical center-of-gravity height ratio H / W that does not cause rollover and the wind speed U for each vehicle mass m when the truck runs on the Karuizawa bus accident curve at 100 km / h.
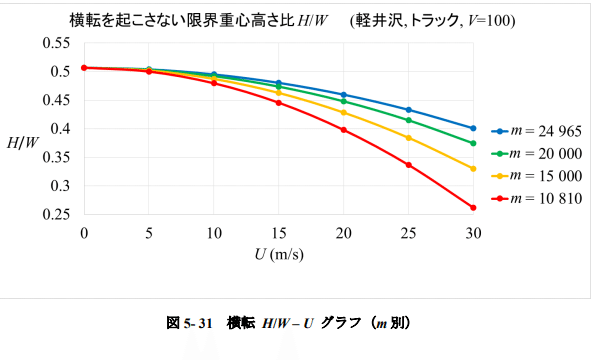
Figure 5-32 shows, for each lateral force coefficient CD, the relationship between the critical center-of-gravity height ratio H / W at which the truck does not roll over and the wind speed U when the truck runs on the Karuizawa bus accident curve at 100 km / h.
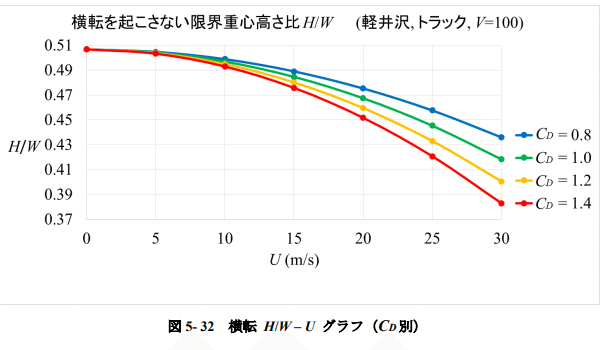
Figure 5-33 shows the relationship between the critical center-of-gravity height ratio H / W that does not cause rollover and the wind speed U when the truck runs on the Karuizawa Bus Accident Curve at a speed of 100 km / h for each one-sided slope α.
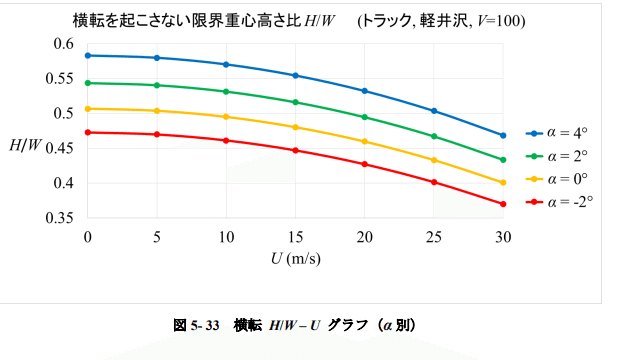
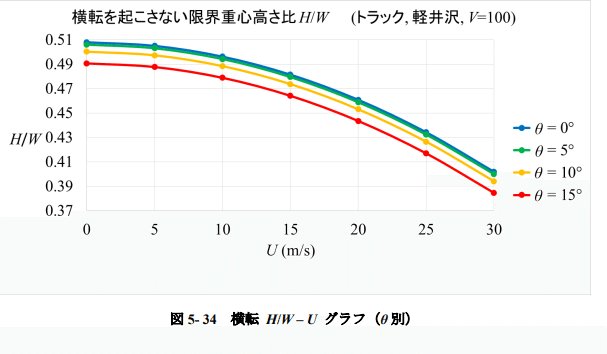
Figure 5-34 shows the relationship between the critical center-of-gravity height ratio H / W that does not cause rollover and the wind speed U for each vertical gradient θ when the truck runs on the Karuizawa bus accident curve at 100 km / h.
(Note)
In this chapter, model cars were determined as “bus”, “truck”, “normal car”, and “mini car” and analyzed based on the data. For convenience, “bus”, “truck”, “normal” Car, light automatic
Although they are described as `` cars '' and compared them, for example, even the same `` bus '' is of various types, and it is possible to compare `` bus '', `` truck '', `` regular car '', and `` mini car '' Please note that it was not.
Chapter 6 Conclusion
1. In order to analyze the relational expression of conventional sideslip and rollover, including the longitudinal gradient and wind force,
Here is the formula.
Relational expression when no sideslip occurs
Relational expression when rollover does not occur
This made it possible to study the safety of sideslip and rollover when there is a vertical gradient or wind force.
2. Estimating the critical speed that does not cause sideslip and rollover in the Karuizawa bus accident using the above equation, the critical speed that does not cause sideslip is V = 90.0 km / h, and the critical speed that does not cause rollover is V = 77.2. km / h.
According to the record that the bus was running at V = 96km / h at the time of the accident, it is probable that both sideslip and rollover occurred.
3. Regarding the sideslip, changes in the radius of gyration R and the friction coefficient f greatly affect the critical speed V that does not cause sideslip.
The change in the longitudinal gradient θ has a negligible effect on the critical speed as compared with the one-sided gradient α.
In addition, there was almost no difference between the vehicle types in the range where the wind speed U was small (however, the difference can be expressed if the change in the coefficient of sliding friction can be considered from the performance of the tires, etc.).
This can be said from the fact that according to equation (3.28), all the elements of the car (m, A, CD) are in the term of the wind speed U. As the wind speed U increases, the mass m of the car, the projected area A, the lateral force Factors such as coefficient CD, etc.
However, it was also confirmed that it affected the limit speed.
4. Regarding rollover, changes in the radius of gyration R and the height H of the center of gravity greatly affect the critical speed V at which rollover does not occur.
The effect of the change in the longitudinal gradient θ on the limit speed is very small compared to the one-sided gradient α.
It was quiet.
When considering the height of the center of gravity, it is important to compare the ratio of the height of the center of gravity H to the distance W between the left and right wheels (H / W).
The difference in vehicle type is also due to the difference in the height ratio of the center of gravity H / W.
However, regarding the force of the wind, the higher the centroid height Z, that is, the higher the vehicle height, the more likely the vehicle is to be affected by the wind.
It was also confirmed that as the wind speed U increased, factors such as the vehicle mass m, the projected area A, and the lateral force coefficient CD affected the limit speed.
Future
1. The coefficient of sliding friction between a tire and a road surface is determined by various factors affecting each other.
For example, the coefficient of sliding friction varies greatly depending on the tire shape, wear, difference from studless tires, road material and shape, etc.
In addition, the lateral force coefficient and the height of the center of gravity are assumed from the literature and the shape of the vehicle, and lack accuracy.
Making them as accurate as possible gives more realistic results.
2.In this study, the analysis was performed with the speed kept constant.
The work was extremely dangerous, and the acceleration caused the accident in the Karuizawa Bus accident.
It is very meaningful to analyze including that.
Proposal
Excessive speed can be said to be the most important factor in the accidents discussed in this report.
There will be countless accidents that could be prevented if there were automatic control and a function to call attention before reaching the height of the steep center of gravity.
I hope that technological progress and such a tragic accident will never happen again.
この記事が気に入ったらサポートをしてみませんか?