
Why The United States Is Currently Like Japan In The Year 1995

In my work as a nurse I have the privilege of witnessing first hand the miracles of modern medicine. Humans survive now longer than ever and it is increasingly more common to reach 100 years old or older. Data from Statista shows that the median age in the United States and Japan are rising. While we get to spend precious more time with our elderly loved ones, an increasingly aging population coupled with data that shows that fertility and birth rates are declining, present a concerning forecast for the future of economic growth for the United States and the world. Japan has already experienced all of this including an older population, population decline, and stagnant growth and inflation. The United States may already be traveling down that same road.
The Japan Situation
The population of Japan has been aging and shrinking. According to Statista, the median age in Japan has increased from 22 years old in 1950 to 48 in 2020. This means that 50 percent of Japan's population are older than 48 years old.

According to World Bank, Japan’s population peaked at 128 million people in 2010, declined to 125.7 million in 2021, and is still falling.

One culprit for the decline in Japan's population is a decrease in the fertility rate, or births per every woman. It takes 2.1 children per woman to sustain a population at a stable level. The birth rate in Japan dropped below this threshold in 1974 and has never since recovered. The population subsequently peaked and then began declining 36 years later.

Population dynamics is only one aspect of economic growth, but it should be noted that following a peak in gross domestic product (GDP) growth of 12.9% in 1968, Japan has failed to sustain average annual GDP growth above 2% since. This stunted growth was hindered further following the バブル景気, (baburu keiki, "bubble economy") burst in 1992 and subsequent 失われた十年, (Ushinawareta Jūnen, "lost decade"). Some also refer to the post-1992 years as the "lost 20" or "lost 30" years.

The forces of a declining birth rate and aging population were already in motion well before the asset bubble burst in 1992, but the following recession was a one-two punch the has since plagued Japan with persistently low inflation and anemic growth. The Bank of Japan has tried to no avail to catalyze growth and inflation with unprecedentedly low interest rates and asset purchases, i.e., quantitative easing. Perhaps one reason why the Bank's tools have not succeeded is that the problem is not just monetary but is rather human in nature.
The United States Situation
Unlike Japan, the United States has experienced unabated population growth since 1960. The U.S. population has nearly doubled from 180 million people in 1960 to 332 million in 2021 according to World Bank.

However, there are trends emerging similar to what happened in Japan that raise concerns about what the future of U.S. growth my hold.
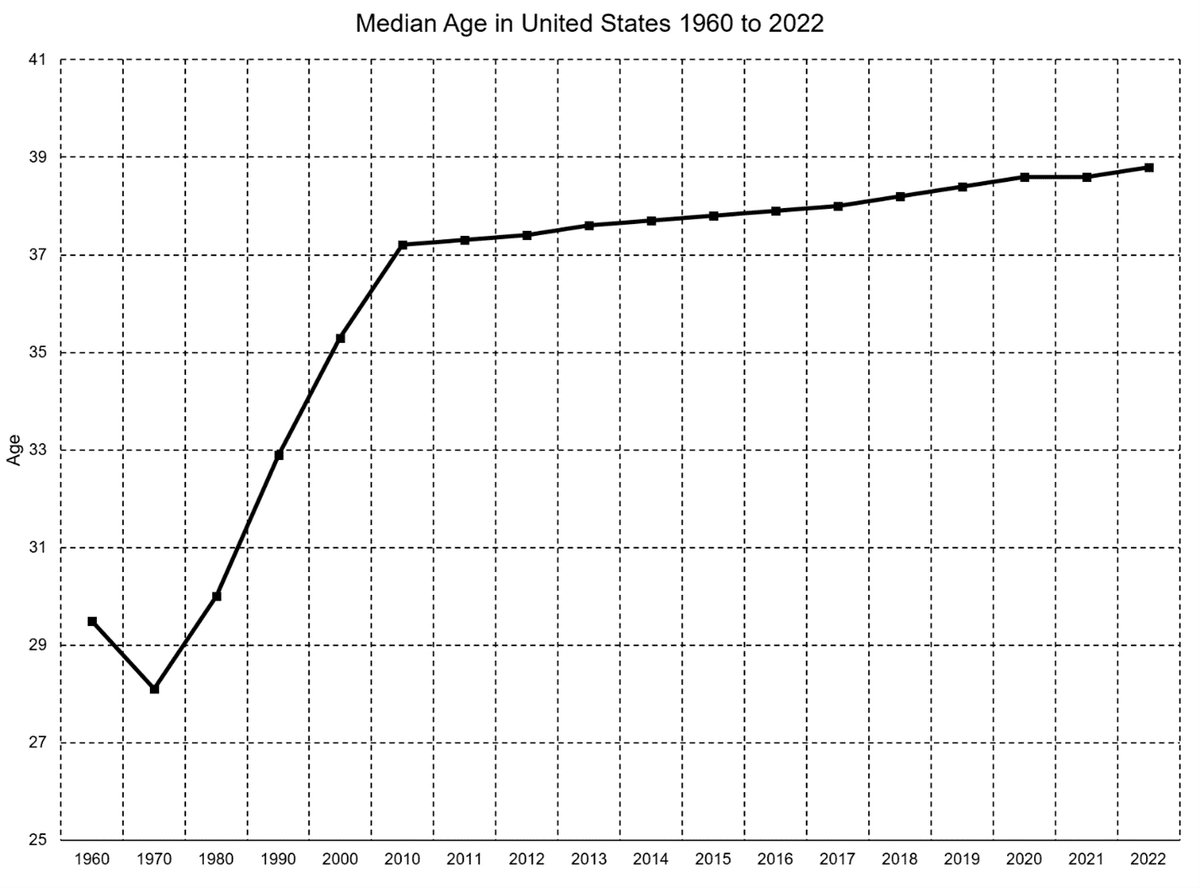
First, the median age in the U.S. is increasing in an upward trend similar to Japan. According to Statista, the median age in the U.S. has increased from 29.5 in 1960 to almost 39 years old in 2022. Again, this means that 50% of the U.S. population is 39 years old or older.
Second, the birth rate in the U.S. is also on the decline like Japan. The birth rate dropped below 2.1 in 1972, two years before Japan’s similar decrease, according to World Bank, but recovered in 1990 and ranged between 2 and 2.1 until 2009 where the birth rate fell below 2 again and then just continued to decline. By 2020, the birth rate is down to an unprecedented low of 1.6.

If we use the trends experienced in Japan and apply them to the United States looking forward, the U.S. population could begin to “round off” and peak potentially as soon as the year 2045 and then begin to shrink. The U.S. Congressional Budget Office (CBO) offers a similar view and estimates the U.S. population peaking at 369 million people by 2052.
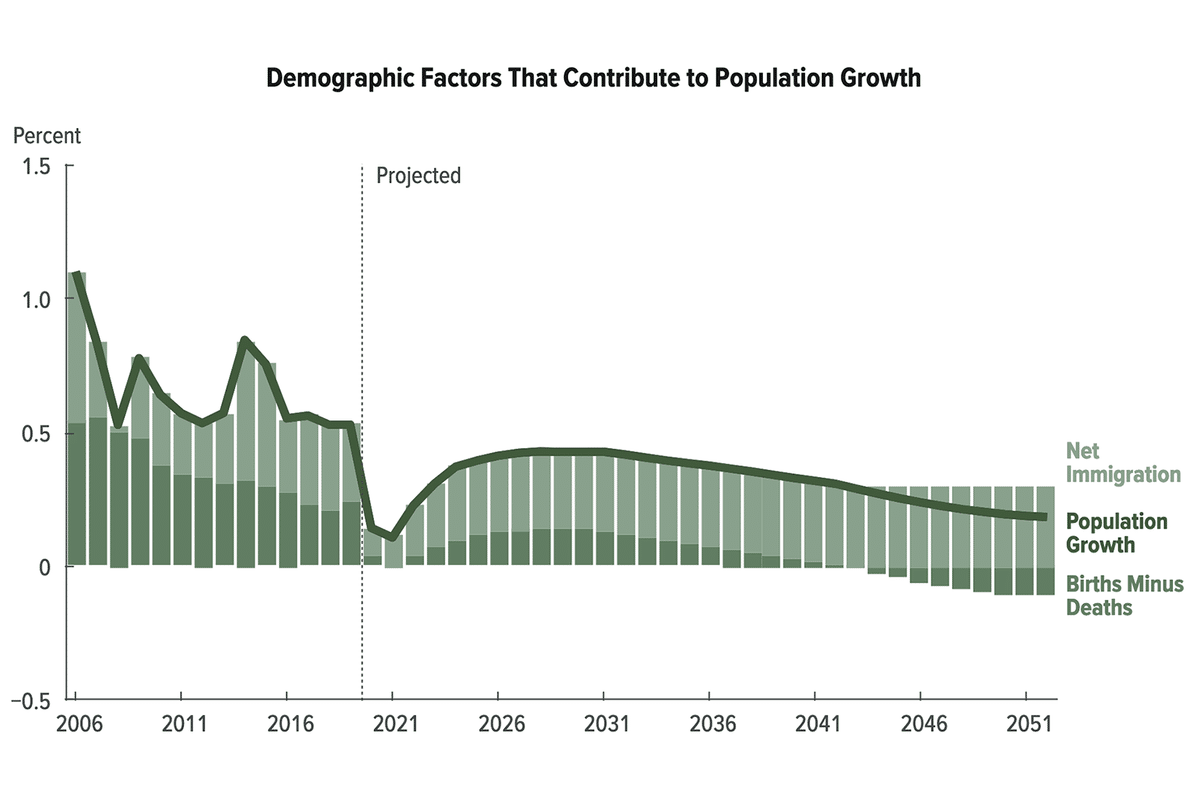
One key difference between Japan and the U.S. is immigration. The U.S. admits many more immigrants than Japan. According to World Bank, migrants account for only two million of Japan’s population (less than two percent). In the U.S., almost 15% of the population are migrants (46 million people).

Immigration's role in U.S. population growth is key. The CBO estimates that immigration will account for 100 percent of U.S. population growth after the year 2043. Unlike Japan, the U.S. has this additional resource to prolong the time until the population peaks and begins to shrink. Furthermore, depending on how U.S. immigration policy evolves in the years to come, population peak and decline could be forestalled even further by loosening immigration barriers. Conversely, population peak and subsequent decline could occur sooner if more isolationist policies are implemented. The government of Japan could perhaps look at improving their immigration policy to more easy allow foreign migration and investment which may help improve their population and economic situations.
A World Problem
Japan and the United States are not unique to the problems of declining birth rates and populations. Thomas Piketty presented the following data in 2013 in Capital in the 21st Century showing how the growth rate of the world population overall peaked between 1950 and 1990 and is now declining.

Population dynamics is only one factor of economic growth, but its involvement in the projected decline of world growth from 4% from 1950 to 1990 to 1.5% in 2100 is probably at least somewhat significant.

Conclusion
The median age in the United States is now almost 39 years old. Japan had a median age of 39 back in 1995, near the beginning of the Ushinawareta Jūnen ("the lost decade"). The U.S. has experienced an average GDP growth rate of three percent per year compared to Japan's 1.5%. If the current trends of an aging population and low and declining birthrate persist in the United States, a decline in the population may also negatively impact GDP growth. It is impossible to predict if, when, or what the magnitude a decline of GDP growth might be in the U.S.; but a decline from even 3.0 to 1.5% GDP growth represents hundreds of billions of Dollars of lost productivity every year. This decline in growth would also be coupled with higher and increasing healthcare costs associated with caring for an older population that is living longer. Unlike Japan, the U.S. accepts more immigrants which will help slow the decline in population and at least temporarily prolong a decline in productivity, but this is projected to have limitations after the year 2052 and will also depend on the path of immigration policy in the years to come.

Summary
1. The United States' population is aging.
2. The U.S. birth rate is declining and fell below the rate needed to sustain the population at a stable level in 2009. It has not recovered since.
3. The U.S. population may peak by 2045 and begin declining by 2052.
4. Japan has historically experienced population aging, population peak, and decline. This, along with other factors, contributed to low economic growth and inflation that is unresponsive to the actions of Japan's central bank.
5. The U.S. is at risk of following in Japan's footsteps in terms of future growth, but has the advantage of higher immigration which can help offset population and productivity decline.
この記事が気に入ったらサポートをしてみませんか?