
タイムズカーの利用時間料金をPython matplotlibでグラフ化。時間料金の変化点を把握して有効に利用しよう。

Pythonを最近業務で少し使用するようになったので、勉強のため普段利用しているカーシェアサービスのタイムズカーの利用時間料金について、matplotlibライブラリを使ってグラフ化してみました。
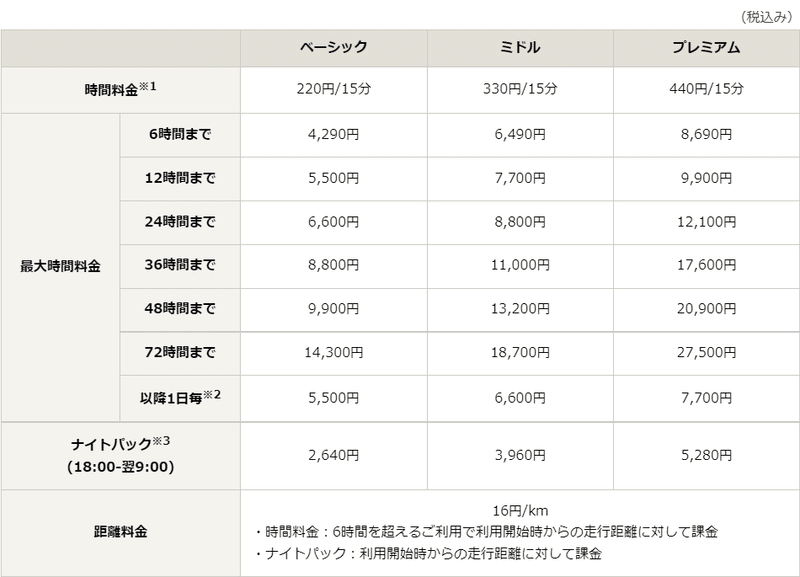
タイムズカーの時間料金
カーシェアの利用料金は、基本の時間料金と最大時間料金がきまっており、各最大時間料金に達するまでは15分単位で基本料金が加算されていきます。これをグラフ化します。
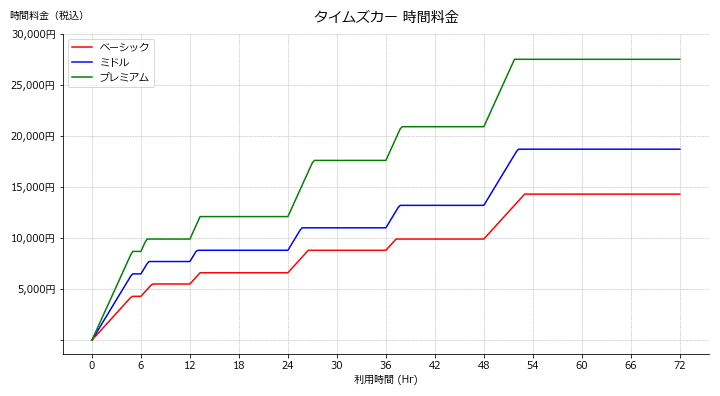
各クラスの時間料金グラフ
まずは、各クラスの料金体系のリストを作って、matplotlibでグラフ化してみます。
# Python
import matplotlib.pyplot as plt
import numpy as np
import pandas as pd

plt.rcParams["font.family"] = "Meiryo"

# 15分当たりの時間料金

basic = 220 * (1 / 0.25)
middle = basic * 1.5
premium = basic * 2

# 最大利用時間
maxtime_basic = {6: 4290, 12: 5500, 24: 6600, 36: 8800, 48: 9900, 72: 14300}
maxtime_middle = {6: 6490, 12: 7700, 24: 8800, 36: 11000, 48: 13200, 72: 18700}
maxtime_premium = {6: 8690, 12: 9900, 24: 12100, 36: 17600, 48: 20900, 72: 27500}

# 15分(0.25hr)間隔の時間軸
time = np.arange(0, 72.25, 0.25)

def timefee(charge: str, maxtime: dict):

    timefee = []
    max6, max12, max24, max36, max48, max72 = list(maxtime.values())

    for t in time:
        if t <= 6:
            if t * charge < max6:
                y = t * charge
            else:
                y = max6

        elif 6 < t <= 12:
            if (t - 6) * charge + max6 < max12:
                y = (t - 6) * charge + max6
            else:
                y = max12

        elif 12 < t <= 24:
            if (t - 12) * charge + max12 < max24:
                y = (t - 12) * charge + max12
            else:
                y = max24

        elif 24 < t <= 36:
            if (t - 24) * charge + max24 < max36:
                y = (t - 24) * charge + max24
            else:
                y = max36

        elif 36 < t <= 48:
            if (t - 36) * charge + max36 < max48:
                y = (t - 36) * charge + max36
            else:
                y = max48

        elif 48 < t <= 72:
            if (t - 48) * charge + max48 < max72:
                y = (t - 48) * charge + max48
            else:
                y = max72

        timefee.append(y)
    return timefee


# 最大時間料金
timefee_basic = timefee(basic, maxtime_basic)
timefee_middle = timefee(middle, maxtime_middle)
timefee_premium = timefee(premium, maxtime_premium)

# グラフ作成
fig, ax = plt.subplots(figsize=(14, 6), tight_layout=True)
ax.set_title("タイムズカー 時間料金", y=1.02, fontsize=14.0)
ax.plot(time, timefee_basic, color="r", label="ベーシック")
ax.plot(time, timefee_middle, color="b", label="ミドル")
ax.plot(time, timefee_premium, color="g", label="プレミアム")

ax.set_xlabel("利用時間 (Hr)")
ax.set_ylabel("時間料金(税込)", rotation=0)
ax.yaxis.set_label_coords(-0.02, 1.04)

ax.set_xticks(np.arange(0, 72.5, 6))
ax.set_yticks(np.arange(0, 35000, 5000))
ax.set_yticklabels([f"{x:,}円" for x in np.arange(0, 35000, 5000)])

ax.legend()
ax.grid(ls="--", lw=0.5)

ax.spines["right"].set_visible(False)
ax.spines["top"].set_visible(False)

fig.savefig("タイムズカー時間料金_全クラス.png", facecolor="w", dpi=300)

plt.show()
24時間以内のグラフ(StepPlot)
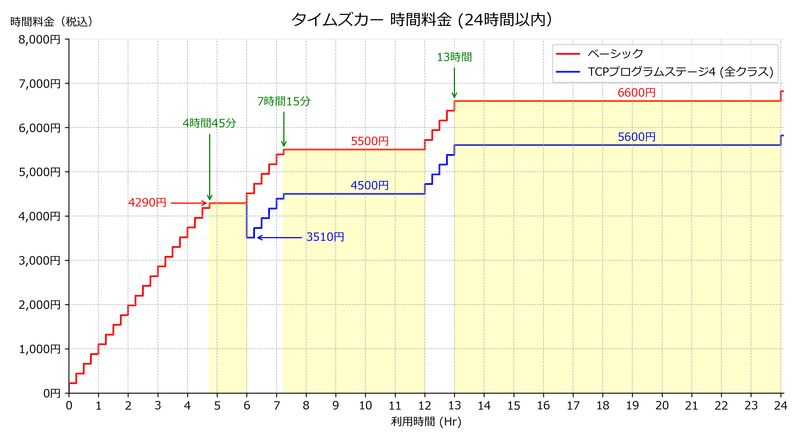
次に24時間以内の料金について、詳細なグラフを作成してみました。今度はstep plotで階段状にグラフを表示してます。また、一定料金となる範囲(バンド)に色をつけて、開始時間と一定料金をannotationで示しました。
# TCPプログラムステージ4は6時間以上利用で-1000円
tcp_s4 = [i - 1000 if i > 4290 else i for i in timefee_basic]

# グラフの作成
fig, ax = plt.subplots(figsize=(10, 5.5), tight_layout=True)
ax.set_title("タイムズカー 時間料金 (24時間以内)", y=1.02, fontsize=14.0)

ax.step(time, timefee_basic, color="r", label="ベーシック", zorder=1)
ax.step(time, tcp_s4, color="b", label="TCPプログラムステージ4 (全クラス)", zorder=0.5)

ax.set_xlim(0, 24.1)
ax.set_ylim(0, 8000)

ax.set_ylabel("時間料金(税込)", rotation=0)
ax.yaxis.set_label_coords(-0.02, 1.03)
ax.set_yticks(np.arange(0, 9000, 1000))
ax.set_yticklabels([f"{x:,}円" for x in np.arange(0, 9000, 1000)])

ax.set_xticks(np.arange(0, 24.5, 1))
ax.set_xlabel("利用時間 (Hr)")

# テキスト & 注釈
ax.text(9.5, 5600, "5500円", color="red")
ax.text(18.5, 6700, "6600円", color="red")
ax.text(9.5, 4600, "4500円", color="b")
ax.text(18.5, 5700, "5600円", color="b")
ax.axvspan(4.75, 6, 0, 4290 / 8000, color="yellow", alpha=0.2)
ax.axvspan(7.25, 12, 0, 5500 / 8000, color="yellow", alpha=0.2)
ax.axvspan(13, 24, 0, 6600 / 8000, color="yellow", alpha=0.2)
ax.annotate(
    "4時間45分",
    xy=(4.75, 4290),
    xytext=(4.75, 6000),
    color="g",
    arrowprops=dict(arrowstyle="->", color="g"),
    horizontalalignment="center",
)
ax.annotate(
    "7時間15分",
    xy=(7.25, 5500),
    xytext=(7.25, 6500),
    color="g",
    arrowprops=dict(arrowstyle="->", color="g"),
    horizontalalignment="center",
)
ax.annotate(
    "13時間",
    xy=(13.0, 6600),
    xytext=(13.0, 7500),
    color="g",
    arrowprops=dict(arrowstyle="->", color="g"),
    horizontalalignment="center",
)
ax.annotate(
    "3510円",
    xy=(6.25, 3510),
    xytext=(8.0, 3510),
    color="b",
    arrowprops=dict(arrowstyle="->", color="b"),
    verticalalignment="center",
)
ax.annotate(
    "4290円",
    xy=(4.75, 4290),
    xytext=(2.0, 4290),
    color="r",
    arrowprops=dict(arrowstyle="->", color="r"),
    verticalalignment="center",
)

ax.legend()
ax.grid(ls="--", lw=0.5)

ax.spines["right"].set_visible(False)
ax.spines["top"].set_visible(False)

fig.savefig("タイムズカー 時間料金 (24時間以内).png", facecolor="w", dpi=300)

plt.show()
タイムズカーのTCPプログラムで最高ランクのステージ4に達すると、すべてのクラスをベーシック料金で利用可能となり、さらに6時間を超える利用で時間料金から1,000円割引となります。その場合もグラフして追加してみました。
グラフ化すると、いつから最大料金に達するか視覚的にわかりやすいと思います。ベーシッククラスの場合、下記時間で料金が一定になるので、有効に利用しましょう。
4時間45分以上 6時間未満: 4290円
7時間15分以上 12時間未満: 5500円
13時間以上 24時間未満: 6600円
TCPプログラムステージ4では、6時間を超えると1,000円割引なので時間料金だけでいうと、4時間を超えた場合、6時間を超えたほうが安くなる場合があります。
6時間を超えると距離料金も16円/kmとして加算される料金体系ですが、実は6時間から6時間15分未満ではかかりません!
実際は6時間15分を過ぎてからかかります。つまり6時間00分~6時間15分間で返すと1,000円割引と距離料金無料が得られるとベストな時間となります。
例えばステージ4の人が200km走り、次の時間使用した場合の料金:
4:45-6:00 4290円 距離料金なし
6:00-6:15 4510円 -1000円 = 3510円
6:15-6:30 4730円 +(200*16 = 3200円)-1000円 = 6930円
料金シミュレーション
最後に各時間の料金体験をPandasでDataframeに格納してcsvとして出力できるようにします。また、それを使って料金をシミュレーションする関数を使ってみました。時間料金も考慮して合計料金を計算します。
# dataframeに格納
df = pd.DataFrame(list(zip(timefee_basic, timefee_middle, timefee_premium)),time,dtype=int,
    columns=["ベーシック", "ミドル", "プレミアム"])

# csv出力
# df.to_csv('times.csv', encoding ='cp932')


def timescar_price(hour: int, minute: int, distance: int, car_class="ベーシック"):
    """
     タイムズカーの料金シミュレーション
    """
    # 時間料金
    m = (minute // 15) * 15  # 15分単位で丸める(切り捨て)

    time = hour + (m / 60)
    timefee = df.at[time, car_class]

    # 距離料金 1km: 16円
    if hour < 6:
        distance_charge = 0
    else:
        distance_charge = 16 * distance

    # 合計金額
    total = timefee + distance_charge

    print(f"合計金額:{total} 円(時間料金:{timefee} 円, 距離料金:{distance_charge} 円)")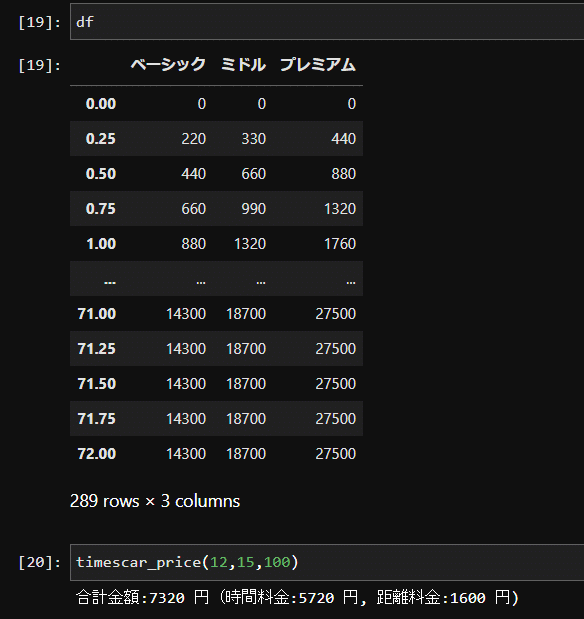
以上、タイムズカーの時間料金を把握してお得に使いましょう。