pythonででんき家計簿データのcsvをmatplotlibでグラフ表示する

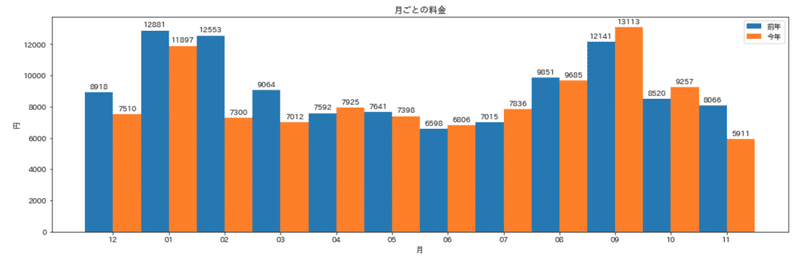
前回、前年と今年の電気使用量を並べて表示するためにpandasのグラフ表示を使うのが楽だったのでそうしてみたが、matplotlibの公式サイトにそのような表示方法のサンプルが掲載されていたのでそれに従って表示してみた(今回は料金)。
結局の所、グラフのバーを表示するときにその表示の幅を去年の分と今年の分とを計算して半分ずつずらして表示するということが必要らしい。更にサンプルではそれぞれの棒グラフの上に値を表示するようにもなっていてなかなか見栄えが良い。
import matplotlib
import matplotlib.pyplot as plt
import japanize_matplotlib  # macで日本語表示する場合に必要 pip install japanize_matplotlib
import numpy as np
import os
import csv
import re

file='ELECT_USAGE_20201109223152.csv'  # 24ヶ月分のデータ
year_month = [[],[]]
yen = [[],[]]
watt = [[],[]]

i = 0
with open(file, encoding="shift_jis") as f:
   reader = csv.reader(f)
   for row in reader:
       if row[0] != "従量電灯B":
           continue
       index = i // 12
       year_month[index].append(row[3])
       yen[index].append(int(row[5]))
       watt[index].append(int(row[6]))
       i += 1

x_labels = [re.sub(r'.*/(.*)', r'\1', i) for i in year_month[0][0:12]]
x = np.arange(len(x_labels))  # the label locations
width = 0.5  # the width of the bars
fig, ax = plt.subplots(figsize=(15,5))
rects1 = ax.bar(x - width/2, yen[0], width, label='前年')
rects2 = ax.bar(x + width/2, yen[1], width, label='今年')

# Add some text for labels, title and custom x-axis tick labels, etc.
ax.set_ylabel('円')
ax.set_xlabel('月')
ax.set_title('月ごとの料金')
ax.set_xticks(x)
ax.set_xticklabels(x_labels)
ax.legend()

def autolabel(rects):
   """Attach a text label above each bar in *rects*, displaying its height."""
   for rect in rects:
       height = rect.get_height()
       ax.annotate('{}'.format(height),
                   xy=(rect.get_x() + rect.get_width() / 2, height),
                   xytext=(0, 3),  # 3 points vertical offset
                   textcoords="offset points",
                   ha='center', va='bottom')

autolabel(rects1)
autolabel(rects2)
fig.tight_layout()
plt.show()
結果
ここでのエッセンス
- csvファイルをcsvモジュールで読み込む。
- matplotlibで同じXの位置に2種類のデータの棒グラフを表示する。
- matplotlibで棒グラフの上にその値を表示する。
この記事が気に入ったらサポートをしてみませんか?