
フットボール統計学 クロスの開始地点と終了地点の分析

This article is a written version of Garry Gelade’s 2017 OptaPro Analytics Forum presentation on crossing. Garry’s work featured in the Guardian and Garry also conducted interviews on both the Keys and Gray Show and TalkSport.
この記事は、Garry Gelade氏の2017年OptaPro Analytics Forumのプレゼンテーションの執筆版である。Garryの作品はガーディアンに掲載されており、また、GarryはKeys and Grey ShowとTalkSportの両方でインタビューを行った。
Figure 1. 1000 random crosses

What people think and what the numbers prove
人々が考えることと数字が証明すること
A great cross is one of the most memorable sights in football, but is crossing an effective form of attack? Some say it is now out-dated in the modern game and remains a fossilised English obsession. It is true that the past six years have seen a decline in the number of crosses in top European football from around 17.5 per match in 2010-11 to 15 in 2016-17; but the numbers show no difference between the Premier League and other top European leagues.
偉大なクロスは、フットボールで最も記憶に残る名所の一つだが、クロスは効果的な攻撃の形態だろうか。現代のゲームで時代遅れになっており、化石化した英語の執着が残っていると言う人々もいる。過去6年間で、トップヨーロッパフットボールのクロスの数は、2010-11シーズンの1試合当たり約17.5回から2016-17シーズンの15回まで低下したことは事実である。しかし、数字はプレミアリーグと他のトップヨーロッパリーグとの間に差がないことを示している。
Some claim that crossing is ineffective, arguing that it takes 92 crosses to score a goal. But that number only considers the immediate effect of a cross. When we acknowledge the indirect effects of a cross (goals scored from the second ball, corners and penalties conceded) we find that it needs only about 45 crosses to produce a goal – a much better return.
一部の人々は、クロスが非効果的と主張し、得点するために92回のクロスが必要だと主張する。しかしその数字は、クロスの直接的な影響しか考慮していない。クロスの間接的な影響(セカンドボール、CK、PK)を認めると、得点するには約45回のクロスが必要とわかり、はるかに良いリターンである。
The most extreme critique of crossing has come from the Czech economist Professor Jan Vecer. Vecer argued that crossing is not only ineffective but counter-productive. In a detailed statistical analysis he showed that teams that cross less score more goals, and he concluded that if Premier League teams stopped crossing altogether, they would score an extra 15 goals per season.
クロスの最も極端な批判は、チェコの経済学者のJan Vecer教授からである。Vecer氏は、クロスは非効果的なだけでなく、反独創的であると主張した。詳細な統計分析では、クロスがより少ないチームはより得点が多いことを示し、プレミアリーグのチームがみなクロスを止めた場合、1シーズン当たり更に15ゴールを追加すると結論づけた。
Unfortunately this argument embodies a causal misconception, as we can see when we look at how the scoreline evolves over the 90 minutes. I analysed changes in crossing rates using the framework shown in Figure 2. I divided the games into segments at the points where goals were scored and examined how the frequency of crosses changed according to whether a team scored or conceded a goal.
残念なことに、この議論は、スコアラインが90分間にどのように進化するかを見ると、因果誤解を体現している。図2に示すフレームワークを使用してクロス率の変化を分析した。ゴールが決まった時点でゲームを区分に分け、チームが得点したか失点したかによってクロスの頻度がどのように変化するかを調べた。
Figure 2. Analysis of changes in crossing rate

The results were clear: crossing decreases after a team scores a goal, and increases after a team concedes a goal.
結果は明らかだった。チームがゴールを決めた後にクロスは減少し、チームが失点した後に増加する。
Teams don’t score more goals because they cross less - they cross less because they score more. And that is quite a different thing. It makes footballing sense; a team in the lead will usually play more defensively than when they are behind. There is no evidence that reducing crosses will increase the number of goals scored.
チームはクロスが少ないから得点が多いのではなく、得点が多いからクロスが少ないのである。それはまったく別物である。それはフットボールで理解できる。リードのチームは通常、ビハインドの時よりも守備的にプレーする。クロスを減らすと得点の数が増えるという証拠はない。
Finding the most effective type of cross
最も効果的なクロスの種類を見つける
What is the most effective type of cross? Where should a team cross from, and where should they direct their crosses? I analysed 33,954 crosses from three seasons of the Premier League, of which 666 were successful (a cross was deemed successful if it was followed by a goal within the next six seconds).
最も効果的なクロスとは何か。チームはどこからクロスを上げるべきか、どこへクロスを向けるべきか。プレミアリーグの3シーズンから33,954回のクロスを分析し、そのうち666回が成功した(6秒以内にゴールが決まると成功したと見なす)。
To classify the crosses I used a statistical technique called the Conditional Inference Tree. To show how this works, I applied it to an example slightly removed from crossing in professional football. I've applied it to finding categories of survivors from the Titanic disaster, where the great 'unsinkable' ship with 2120 souls on board sank in the icy waters of the Atlantic in February 1912. The tree algorithm discovered nine categories of survivors as shown in the diagram below.
十字を分類するために、私は条件付き推論ツリーと呼ばれる統計的手法を使用した。これがどのように機能するかを示すために、私はそれをプロのフットボールのクロスから少し外した例に適用した。それを1920年2月大西洋のタイタニック号に適用した。ツリーアルゴリズムは、以下の図に示すように9つの生存者カテゴリーを発見した。

We can see for example that survival rates of women tend to be higher than those of men. The survival rate of women travelling first class (.97) was about twice as high as that of women travelling 3rd class. Only 16% of men travelling 3rd class and 34% of men travelling 1st class survived. Truly a case of women and children first.
例えば、女性の生存率は男性よりも高い傾向にあることがわかる。ファーストクラスの女性の生存率(.97)は、サードクラスの女性の生存率の約2倍だった。サードクラス男性の16%とファーストクラスの男性の34%のみが生き残った。本当に女性と子供ファーストだった。
The conditional inference tree is particularly useful when the number of successes in the data sample is small compared to the number of failures (in fact the more traditional type of regression tree which I tried first, failed to detect any signals at all).
条件付き推論ツリーは、データサンプルの成功回数が失敗回数と比較して小さい場合に特に便利である(実際に、最初に試した従来の回帰ツリーの種類は、全く信号を検出できなかった)。
Applied to our crossing data, the Conditional Inference Tree discovered distinct categories of cross which varied according to their start and end locations, whether they were chipped or driven, and which had success rates ranging from 0.2% to 11.8%. The crosses with the lowest success rates were those that were either too short or too long, in other words passes landing beyond the far post or short of the near post. The most successful category of cross was a driven pass that just crossed the centre line by no more than five metres.
クロスデータに適用すると、条件付き推論ツリーは、開始と終了地点に応じて変化するクロスの異なるカテゴリを発見し、それらはチップかグラウンダーかで成功率は0.2%と11.8%であった。成功率が最も低いのは、短すぎたり長すぎたりすることで、言い換えれば、ファーポストを越えたり、ニアポストの手前である。最も成功したクロスのカテゴリーは、センターラインをわずか5メートル越えただけのグラウンダーである。
The images below illustrate some of the other cross categories, and highlight the difference in success rates that a small change can make.
下の画像は、他のクロスのカテゴリのいくつかを示しており、小さな変化がもたらす成功率の違いを強調している。
Figure 3. Categories 6 and 7 compared


Categories 6 and 7 consist of crosses into the box landing in a region about 4m either side of the near post and between the 18 and six yard lines. Where they differ is the origin of the cross. Category 7 crosses are delivered from deep - behind the penalty box - and have a conversion rate of only 0.5%. Category 6 crosses are delivered from further up the field, which more than triples the success rate to 1.7%.
カテゴリ6、7はニアポストの約4mとペナルティーボックスの間の領域に着陸するボックスへのクロスからなる。異なるのはクロスの開始位置である。カテゴリ7のクロスはペナルティボックスの背後から供給され、変換率はわずか0.5%である。カテゴリー6のクロスは、フィールドのさらに高い位置から供給され、成功率を1.7%以上に倍増する。
Figure 4. Categories 17 and 18 compared


Categories 17 and 18 consist of crosses chipped to the far post originating at least five metres from the touch line and end up no more than five metres from the centre line. The difference between the two is distance from the goal line of the end location. Crosses in Category 17 land behind the penalty spot, while crosses in Category 18 end up between the penalty spot and the goal. This seemingly quite small difference has a big influence on the success rate. The conversion rate for crosses delivered behind the penalty spot is only 2%, but crosses delivered in front of the penalty spot have a success rate of 5.8%.
カテゴリー17と18は、タッチラインから少なくとも5m離れた位置からのチップクロスで構成され、中心線から5m以内になる。2つの違いは、終了位置のゴールラインからの距離である。カテゴリー17のクロスはペナルティスポットの後ろ、カテゴリー18のクロスはペナルティスポットとゴールの間である。このように見えても、かなり小さい差は成功率に大きな影響を与える。ペナルティスポットの後ろへのクロスの変換率はわずか2%だが、前へのクロスは5.8%の成功率を示す。
Application
Together with a representative from a Premier League club, I divided the area from which crosses are most often delivered into four zones (shown in Figure 5). I then consulted the data to make recommendations for maximising success rates from each zone.
プレミアリーグクラブの代表と一緒に、クロスが最も頻繁に配給されるエリアを4つのゾーンに分けた(図5参照)。その後、データを参照して、各ゾーンの成功率を最大化するための推奨事項を作成した。
Figure 5. Four crossing zones
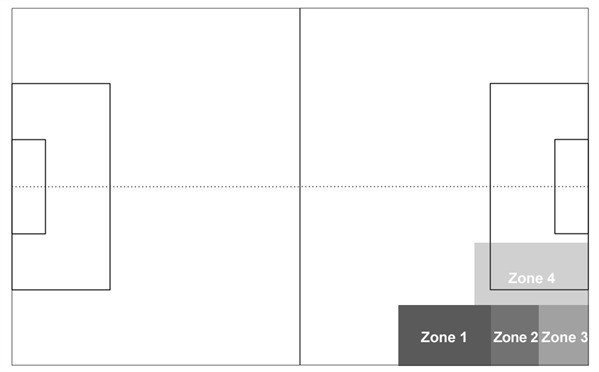
Figure 6a. Recommendations for crossing from zone 1

Figure 6b. Recommendations for crossing from zone 2
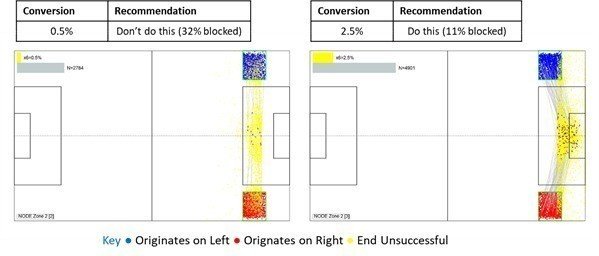
Figure 6c. Recommendations for crossing from Zone 3

Figure 6d. Recommendations for crossing from Zone 4

Conclusions
Crossing got something of a bad name amongst observers of the English game after the failure Damien Comolli’s attempt to build a team based on crossing at Liverpool. With great crossers of the ball like Henderson, Enrique and Downing along with Andy Carroll waiting in the box, Liverpool produced 787 crosses in the 2011-12 season – far more than any other team - for a meagre total of four assisted goals.
Damien Comolliがリバプールでクロスに基づくチームをつくろうとして失敗した後、クロスは英国の試合の観戦者の間で悪名をつけた。ヘンダーソン、エンリケ、スチュワート・ダウニングのようなクロサーはアンディ・キャロルがボックスで待っている中で、リバプールは2011-12シーズンに最多787本のクロスを上げ、たった4つのアシストによる得点だった。
As I’ve written here, the problem was likely that the overemphasis on crossing led to crosses being delivered too early; Liverpool’s crosses originated about three metres further up the pitch than other Premier League teams.
ここに書いたように、クロスの過度の強調はクロスが早すぎることをもたらした可能性があった。リバプールのクロスは、他のプレミアリーグのチームよりピッチの3mほど高かった。
Then again, Liverpool’s style might just have been too predictable. It’s much easier to defend if you know how your opponent is going to play, and common sense suggests it’s good to have a variety of attacking options. If you never cross the ball, or never play through the centre, your opponents have a better chance of nullifying you. So although crossing in isolation may not be the most effective way to score goals, I think it’s important to keep it in the mix.
そして再び、リバプールのスタイルはあまりにも予測可能だったかもしれない。相手がどのようにプレーするのかを知っていれば、守る方がはるかに簡単で、常識的には、さまざまな攻撃オプションがあると良いと示唆する。決してクロスを上げない場合、または中央を決して侵入しない場合、相手は無効化する可能性がより高くなる。よって、孤立したクロスがゴールを決める最も効果的な方法ではないかもしれないが、それをミックスすることが重要だ。
ここから先は
¥ 100
#フットボール統計学