
Trying Data Science(10) : Cramming Logistic Regression

1. Intro
Hello, everyone!
Logistic regression is a simple yet powerful algorithm useful for binary classification problems. This allows you to learn and predict data and use it to predict whether or not to click on an ad.
Today I have summed up logistic regression by online course of Jose Portilla for data scientist.
2. Theory
Logistic Regression as a method for Classification. The convention for binary classification is to have two classes 0 and 1.
We can transform our linear regression to a logistic
regression curve.

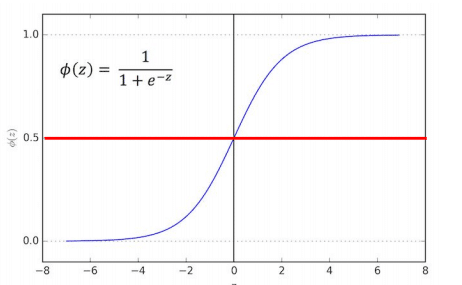
Sigmoid(Logistic) Function
It takes in any value and outputs it to be between 0 and 1. Linear Regression Solution and place it into the Sigmoid Function.


Set a cutoff point at 0.5, anything below it results in
class 0, anything above is class 1.
Confusion matrix

True Positives (TP)
Ture Negatives (TN)
False Positives (FP)
False Negatives (FN)
Accuracy: ( TP + TN ) / Total = 150/165 = 0.91
Misclassification Rate(Error Rate) = ( FP + FN ) / Total = 15/165 = 0.09
Type 1 error = false positive
Type 2 error = false negative
3. Import Libraries
import pandas as pd
import numpy as np
import matplotlib.pyplot as plt
import seaborn as sns
%matplotlib inline
4. Get the Data
ad_data = pd.read_csv('advertising.csv')
ad_data.head()
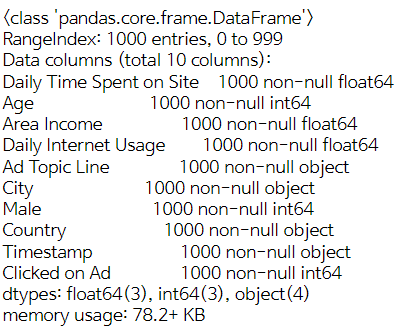
ad_data.info()
ad_data.describe()

5. Exploratory Data Analysis
* Create a histogram of the Age**
sns.set_style('whitegrid')
ad_data['Age'].hist(bins=30)
plt.xlabel('Age')
# Create a jointplot showing Area Income versus Age.
sns.jointplot(x='Age',y='Area Income',data=ad_data)
# Create a jointplot showing the kde distributions of Daily Time spent on site vs. Age
sns.jointplot(x='Age',y='Daily Time Spent on Site',data=ad_data,color='red',kind='kde');
#create a pairplot with the hue defined by the 'Clicked on Ad' column feature.
sns.pairplot(ad_data,hue='Clicked on Ad',palette='bwr')
6. Logistic Regression
Train test split, and train our model.
# Split the data into training set and testing set using train_test_split
from sklearn.model_selection import train_test_split
X = ad_data[['Daily Time Spent on Site', 'Age', 'Area Income','Daily Internet Usage', 'Male']]
y = ad_data['Clicked on Ad']
X_train, X_test, y_train, y_test = train_test_split(X, y, test_size=0.33, random_state=42)
#Train and fit a logistic regression model on the training set.
from sklearn.linear_model import LogisticRegression
logmodel = LogisticRegression()
logmodel.fit(X_train,y_train)
7. Predictions / Evaluations
# predict values for the testing data.
predictions = logmodel.predict(X_test)
#Create a classification report for the model
from sklearn.metrics import classification_report
print(classification_report(y_test,predictions))
8. Outro
Logistic Regression is one of the ways to solve classification problems, and binary classification usually uses two classes: 0 and 1. Linear regression is used by converting it into a logistic regression curve, and any value entered through the sigmoid function is converted to a value between 0 and 1.
Through this concept, I have practiced a tiny data analysis project.
I hope that data analysis and machine learning technologies can lead to more accurate predictions and insights. See ya soon~
ソンさん
この記事が気に入ったらサポートをしてみませんか?