RSI50%以上を緑、50%以下を赤で表示するインジケーター【TradingView】

スクリプトの説明
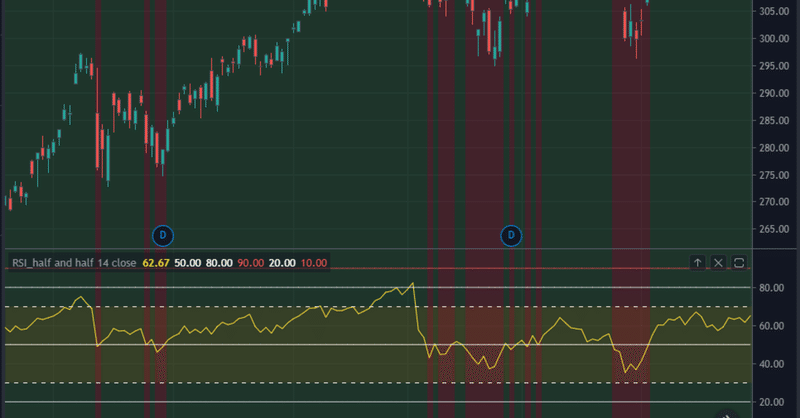
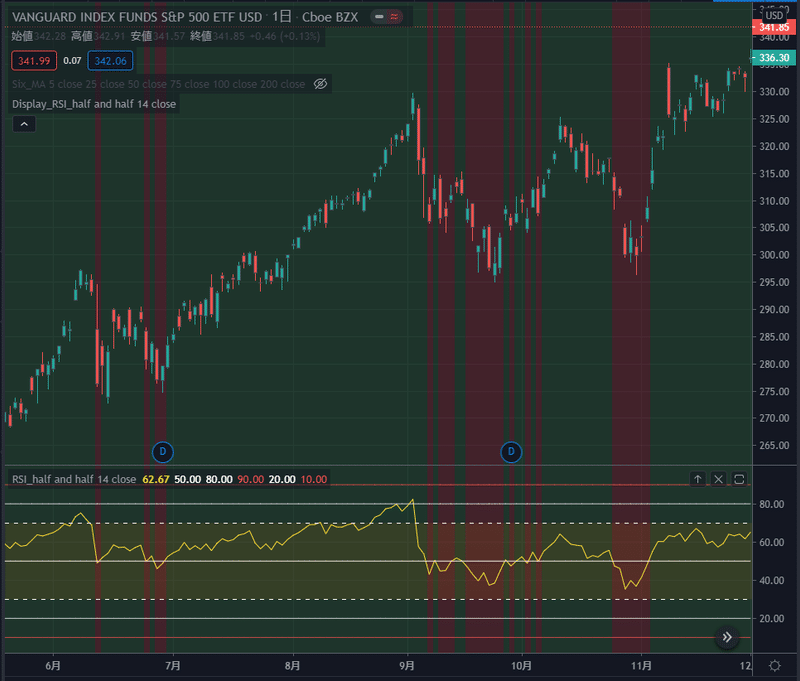
チャート上でRSI 50%以上のところを緑色、50%以下のところを赤色で表示します。
1のスクリプトはオシレータ用、2のスクリプトはトレンド用です。
両方実装するのがおすすめです。
実装方法
https://youtu.be/-NFE0xZ4J14
この動画の(2:21~)で説明しています
使用例
注意!!
スクリプトの利用は自己責任でお願い致します。
何かしらの不備があった場合も責任は負いかねますので、
使用の際にはスクリプトの確認をお願い致します。
スクリプト
1.
//@version=4
study(title="Relative Strength Index", shorttitle="RSI_half and half", format=format.price, precision=2, resolution="")

//入力
len = input(14, minval=1, title="Length")
src = input(close, "Source", type = input.source)

//RSIの計算式
up = rma(max(change(src), 0), len)
down = rma(-min(change(src), 0), len)
rsi = down == 0 ? 100 : up == 0 ? 0 : 100 - (100 / (1 + up / down))

//RSIを表示
plot(rsi, "RSI", color=color.yellow)

//描画表示
band0 = hline(30, title="Lower Band", color=color.white, linestyle=hline.style_dashed, linewidth=1) //水平線30
band1 = hline(70, title="Upper Band", color=color.white, linestyle=hline.style_dashed, linewidth=1) //水平線70
line0 = plot(50, title="Middle Band", color=color.white, linewidth=1, transp=5) //水平線50
line1 = plot(80, title="Upper Upper Band", color=color.white, linewidth=1, transp=25) //水平線80
line2 = plot(90, title="Upper Upper Upper Band", color=color.red, linewidth=1, transp=25) //水平線90
line3 = plot(20, title="Lower Lower Band", color=color.white, linewidth=1, transp=25) //水平線20
line4 = plot(10, title="Lower Lower Lower Band", color=color.red, linewidth=1, transp=25) //水平線10
fill(band1, band0, color=color.orange, transp=90, title="Background") //背景

//背景表示
bgcolor(color = rsi > 50 ? color.green : color.red, transp=80)
2.
//@version=4
study(title="RSI_display", shorttitle="Display_RSI_half and half", overlay=true)

//入力
len = input(14, minval=1, title="Length")
src = input(close, "Source", type = input.source)

//RSIの計算式
up = rma(max(change(src), 0), len)
down = rma(-min(change(src), 0), len)
rsi = down == 0 ? 100 : up == 0 ? 0 : 100 - (100 / (1 + up / down))

//背景表示
bgcolor(color = rsi > 50 ? color.green : color.red, transp=80)この記事が気に入ったらサポートをしてみませんか?