Tokyoの気温の推移と今後について
自己紹介
都内在住40代外資SaaS企業会社員。
仕事に役に立つかわからないが、Aidemyのデータ分析コースで今更PythonとAIの勉強中。
目的
お勉強中のPythonでSARIMAモデルを使って東京の温度を予測し、良則精度について評価を行います。
SARIMAモデルとは
SARIMAモデル(Seasonal AutoRegressive Integrated Moving Average model)は、時系列データの解析と予測に使用される統計モデルです。SARIMAモデルは、ARIMAモデル(自己回帰和分移動平均モデル)に季節性の要素を加えたものです。
分析データ
Kaggleに公開されている過去の世界主要都市の日次平均温度のデータを分析に利用します。
import pandas as pd
# データの読み込み
df = pd.read_csv("city_temperature.csv", low_memory=False)
len(df)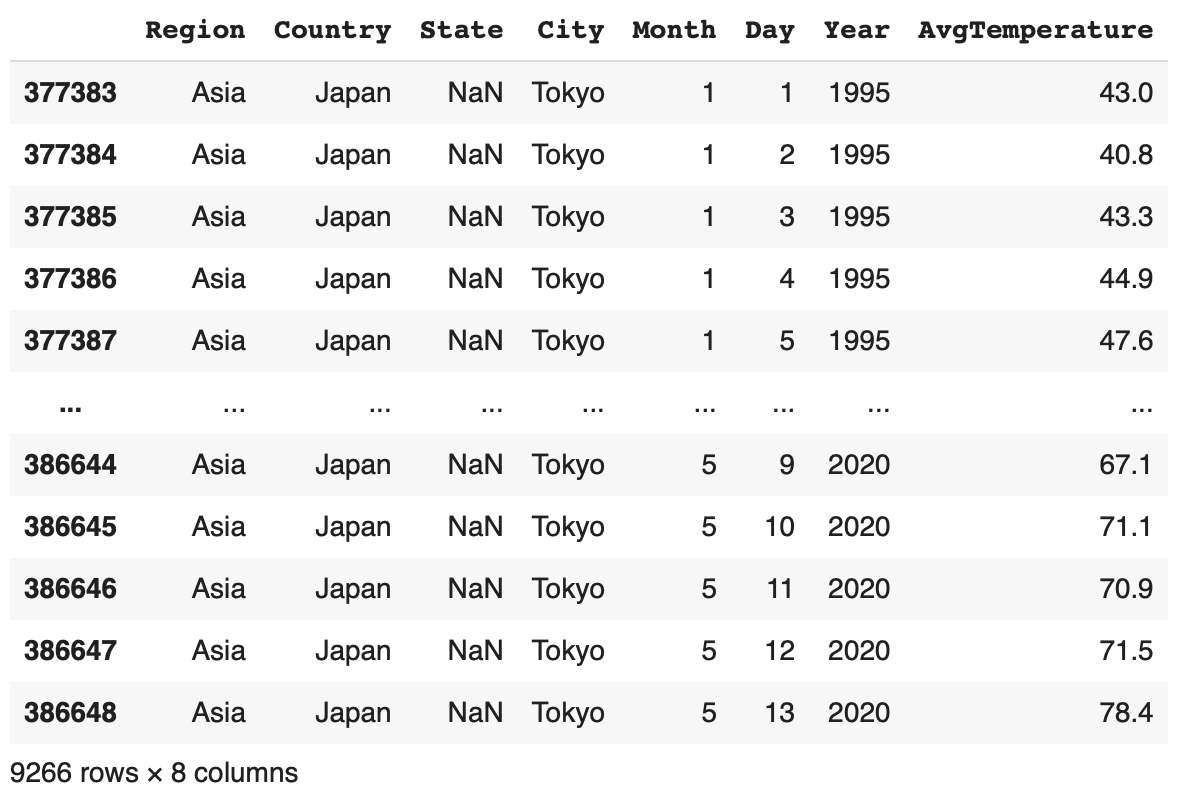
from matplotlib import pyplot as plt
df['AvgTemperature'].plot(kind='hist', bins=20, title='AvgTemperature')
plt.gca().spines[['top', 'right',]].set_visible(False)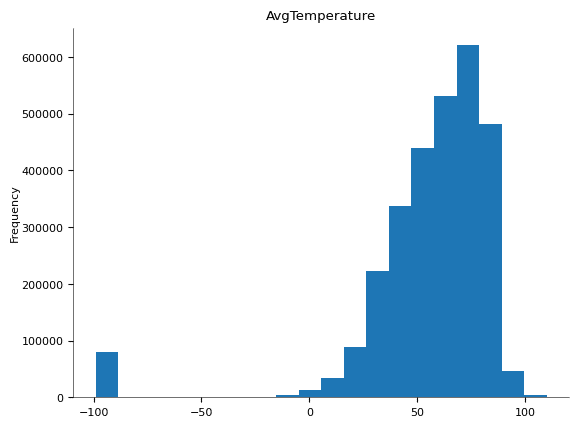
データを見てみると、-99°Fのデータが含まれる様ですがこれは実際にこの様な温度が観測されたのではなく異常値とみなし、分析データより除外します。
データのクレンジング
華氏の温度が分かりにくいので摂氏に変換します。
df_Tokyo.loc[:, 'AvgTemperature2'] = (df_Tokyo_all['AvgTemperature'] - 32) / 1.8# 日付カラムを作成する
df['Date'] = pd.to_datetime(df[['Year', 'Month', 'Day']], errors='coerce')
# エラーのある日付を表示する
error_dates = df[df['Date'].isnull()]
error_dates.head()
# エラーのある日付を修正または削除する
# 例: エラーのある行を削除する場合
df = df.dropna(subset=['Date'])
df = df[df['AvgTemperature'] > -99]東京の気温の傾向
年単位での東京の気温の傾向を見てみます。
import matplotlib.pyplot as plt
import seaborn
from sklearn.linear_model import LinearRegression

# Convert the dates to numerical features
X = df_Tokyo.index.values.astype('datetime64[D]').astype(int).reshape(-1, 1)  # Convert dates to numerical representation
y = df_Tokyo['AvgTemperature2']

model_lr = LinearRegression()
model_lr.fit(X, y)

plt.title("Temperature at Tokyo")
plt.xlabel("Date")
plt.ylabel("AvgTemperature")
plt.plot(x, y, linestyle='--')
plt.plot(x, model_lr.predict(X), linestyle="solid")
plt.show()

# 回帰係数を取り出す
w1 = model_lr.coef_[0]

# 結果を表示
print('モデル関数の回帰変数 w1: %.9f' % w1)
print('y= %.9fx + %.3f' % (w1, model_lr.intercept_))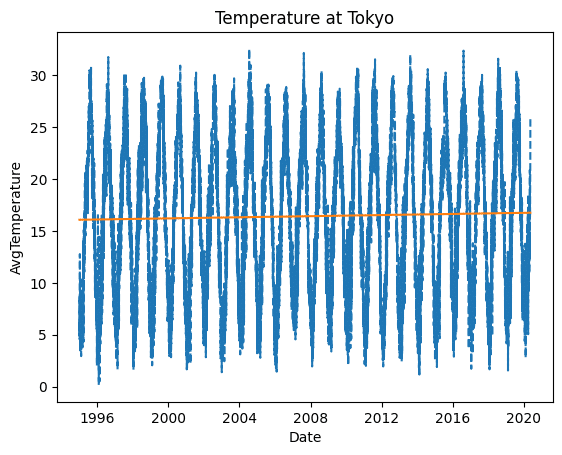
モデル関数の回帰変数 w1: 0.000073255 y= 0.000073255x + 15.4181996年から2021年にわたって1日当たり0.000073255度の気温が上昇している様です。
月単位でも線形回帰により気温の傾向を見てみます。
# 年単位の平均温度データを作成
df_Tokyo_year = df_Tokyo[['Year','AvgTemperature2']].groupby('Year').mean()

# データを折れ線グラフで表す
X = df_Tokyo_year.index.values.astype('datetime64[D]').astype(int).reshape(-1, 1)
y = df_Tokyo_year['AvgTemperature2']

# 線形回帰モデルを作成
model_lr2 = LinearRegression()
model_lr2.fit(X, y)

# グラフを表示
x = df_Tokyo_year.index
y = df_Tokyo_year['AvgTemperature2']
plt.title("Temperature at Tokyo")
plt.xlabel("Year")
plt.ylabel("AvgTemperature")
plt.plot(x, y, linestyle='--')
plt.plot(x, model_lr2.predict(X), linestyle="solid")
plt.show()

# 回帰係数を取り出す
w1 = model_lr.coef_[0]

# 結果を表示
print('モデル関数の回帰変数 w1: %.9f' % w1)
print('y= %.9fx + %.3f' % (w1, model_lr2.intercept_))
# 回帰係数を取り出す
w1 = model_lr2.coef_[0]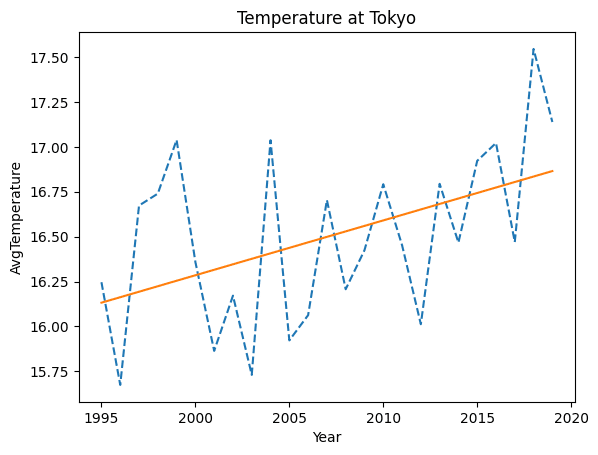
モデル関数の回帰変数 w1: 0.000124265
y= 0.000124265x + -44.793
月当たり0.000124265度の気温が上昇している様です。気温の上昇傾向は明らかですが温暖化と言うほどじゃないんですね。
SARIMAモデルの作成と予想
月データを作成
月単位での予測をするため、月平均データを作成します。
# 月平均のデータセットを作成
df_monthly = df_Tokyo['AvgTemperature2'].resample('M').mean()
モデル作成と60ヶ月間の予測
!pip3 install -q pmdarima
from pmdarima.arima import auto_arima
from dateutil.relativedelta import relativedelta
import pmdarima as pm

# auto_arimaの実行
model = pm.auto_arima(df_monthly, seasonal=True, m=12,
                      stepwise=True, trace=True,
                      error_action='ignore', suppress_warnings=True)

# 最適なパラメータの表示
print(model.summary())

# 予測の生成
n_periods = 60  # 予測する期間(60ヶ月)
forecast, conf_int = model.predict(n_periods=n_periods, return_conf_int=True)
予測結果の可視化
# 予測結果のプロット
index_of_fc = pd.date_range(df_monthly.index[-1] + pd.DateOffset(months=1), periods=n_periods, freq='M')
forecast_series = pd.Series(forecast, index=index_of_fc)
lower_series = pd.Series(conf_int[:, 0], index=index_of_fc)
upper_series = pd.Series(conf_int[:, 1], index=index_of_fc)

plt.plot(forecast_series, label='Forecast')
plt.fill_between(lower_series.index, lower_series, upper_series, color='k', alpha=0.1)
plt.xlabel('Date')
plt.ylabel('Avg Temperature')
plt.title('Monthly Average Temperature Forecast')
plt.legend()
plt.show()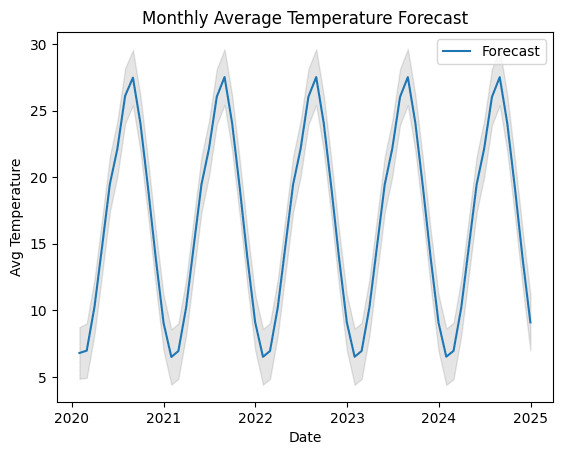
plt.plot(df_monthly, label='Observed')
plt.plot(forecast_series, label='Forecast')
plt.fill_between(lower_series.index, lower_series, upper_series, color='k', alpha=0.1)
plt.xlabel('Date')
plt.ylabel('Avg Temperature')
plt.title('Monthly Average Temperature Forecast')
plt.legend()
plt.show()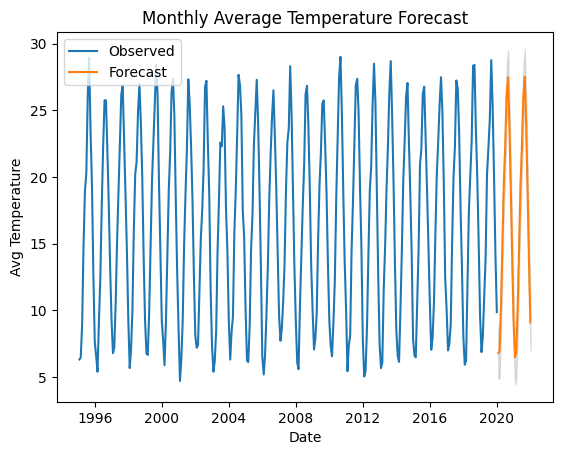
# 月平均のデータセットを作成
df_Tokyo_test_monthly = df_Tokyo_test['AvgTemperature2'].resample('M').mean()
plt.plot(df_Tokyo_test_monthly, label='Observed')
plt.plot(forecast_series, label='Forecast')
plt.xlabel('Date')
plt.ylabel('Avg Temperature')
plt.title('Monthly Average Temperature Forecast')
plt.legend()
plt.show()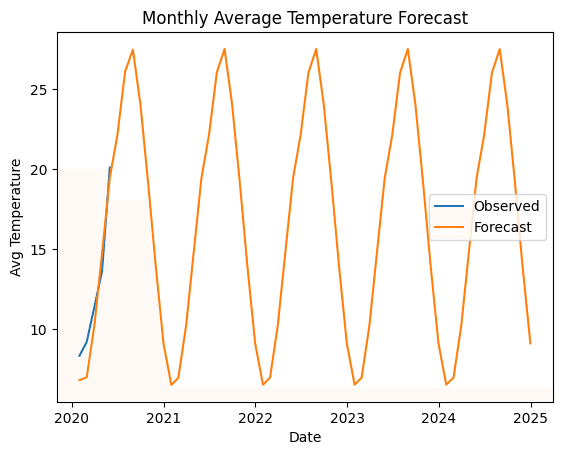
予測値の評価
この予測結果の精度を評価します。評価には以下の2つの指標を用います。
Mean Absolute Error (MAE)
Root Mean Squared Error (RMSE)
Mean Absolute Error (MAE)とは、予測モデルの精度を評価するために使用される指標の一つです。MAEは、予測値と実際の値との絶対誤差の平均を計算することで、予測の誤差の大きさを評価します。以下式がMAEの定義と計算方法です。

Root Mean Squared Error (RMSE)は、予測モデルの精度を評価するための指標の一つで、予測誤差の大きさを測定します。RMSEは、予測値と実際の値との誤差の二乗平均の平方根を計算することで得られます。以下の式がRMSEの定義です。

# 予測結果の評価
from sklearn.metrics import mean_absolute_error, mean_squared_error
import numpy as np

# forecast_seriesとdf_Tokyo_test_monthlyの共通部分のインデックスを取得
common_index = forecast_series.index.intersection(df_Tokyo_test_monthly.index)

# 共通のインデックスを使用して、予測値と実測値を抽出
forecast_series_aligned = forecast_series[common_index]
df_Tokyo_test_monthly_aligned = df_Tokyo_test_monthly[common_index]

mae = mean_absolute_error(df_Tokyo_test_monthly_aligned, forecast_series_aligned)
rmse = np.sqrt(mean_squared_error(df_Tokyo_test_monthly_aligned, forecast_series_aligned))
print(f'Mean Absolute Error (MAE): {mae}')
print(f'Root Mean Squared Error (RMSE): {rmse}')
実行結果
Mean Absolute Error (MAE): 1.3347638707325817
Root Mean Squared Error (RMSE): 1.4341735905189628
MAEが1.33であるということは、予測が実際の値から平均して約1.33度ずれていることを意味します。一方、RMSEが1.43であるということは、予測の誤差が平方根の二乗平均で約1.43度であることを意味します。
結構、月当たり1度以上のズレるので誤差大きいですね。
まとめ
SARIMAモデルを用い過去の東京の気温から将来の気温を予測しました。MAEが1.33、RMSEが1.43の誤差で予測をすることができました。
この記事が気に入ったらサポートをしてみませんか?
